. 2024 Dec 6:15:1522666.
doi: 10.3389/fimmu.2024.1522666. eCollection 2024.

Unravelling turbot (Scophthalmus maximus) resistance to Aeromonas salmonicida: transcriptomic insights from two full-sibling families with divergent susceptibility

Affiliations

Unravelling turbot (Scophthalmus maximus) resistance to Aeromonas salmonicida: transcriptomic insights from two full-sibling families with divergent susceptibility

Patricia Pereiro et al. Front Immunol. .

Abstract

Introduction: Furunculosis, caused by the gram-negative bacterium Aeromonas salmonicida subsp. salmonicida, remains a significant threat to turbot (Scophthalmus maximus) aquaculture. Identifying genetic backgrounds with enhanced disease resistance is critical for improving aquaculture health management, reducing antibiotic dependency, and mitigating economic losses.

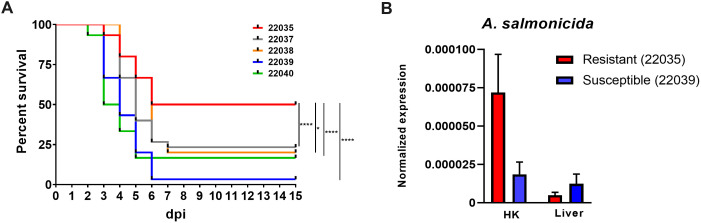
Methods: In this study, five full-sibling turbot families were challenged with A. salmonicida, which revealed one family with significantly greater resistance. Transcriptomic analyses (RNA-Seq) were performed on resistant and susceptible families, examining both naïve and 24-h postinfection (hpi) samples from head kidney and liver tissues.

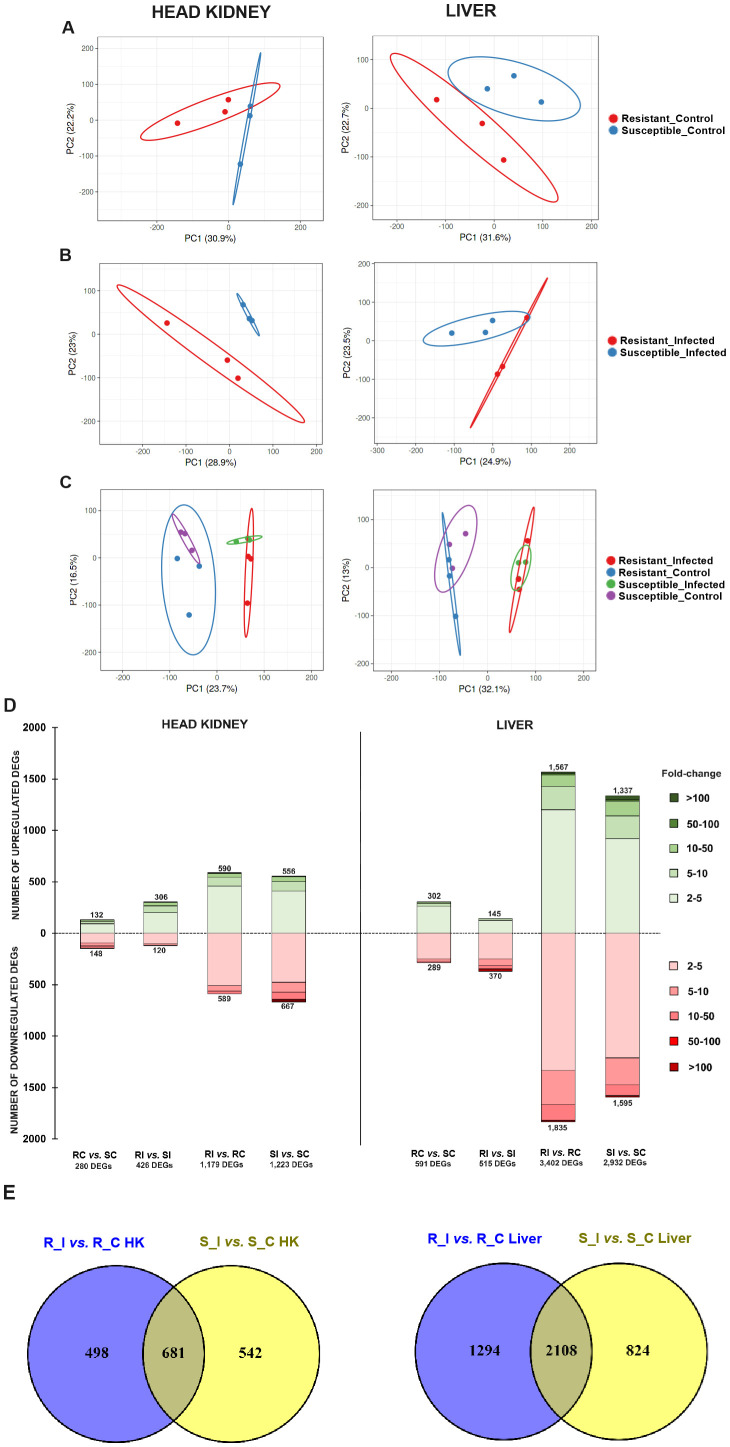
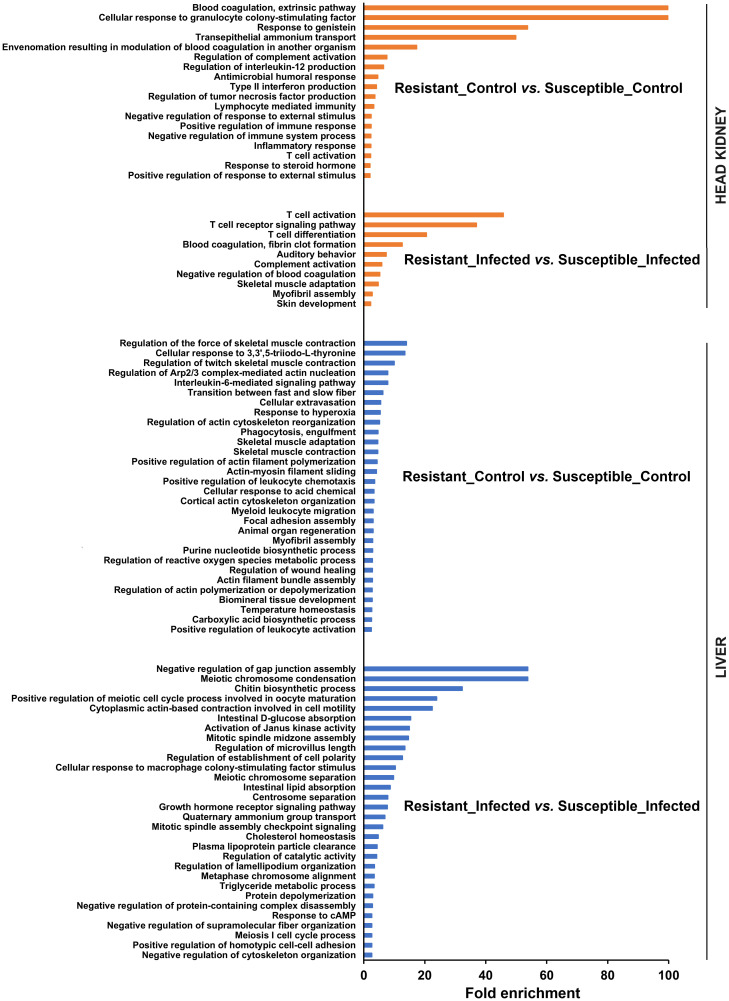
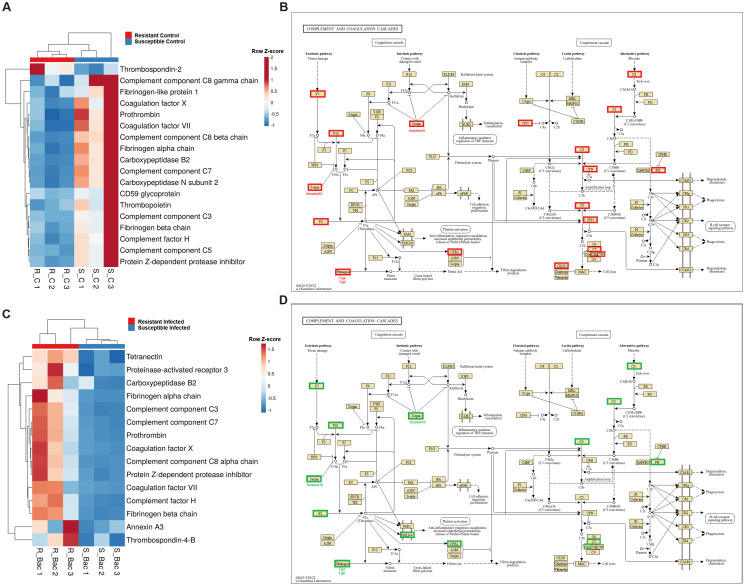
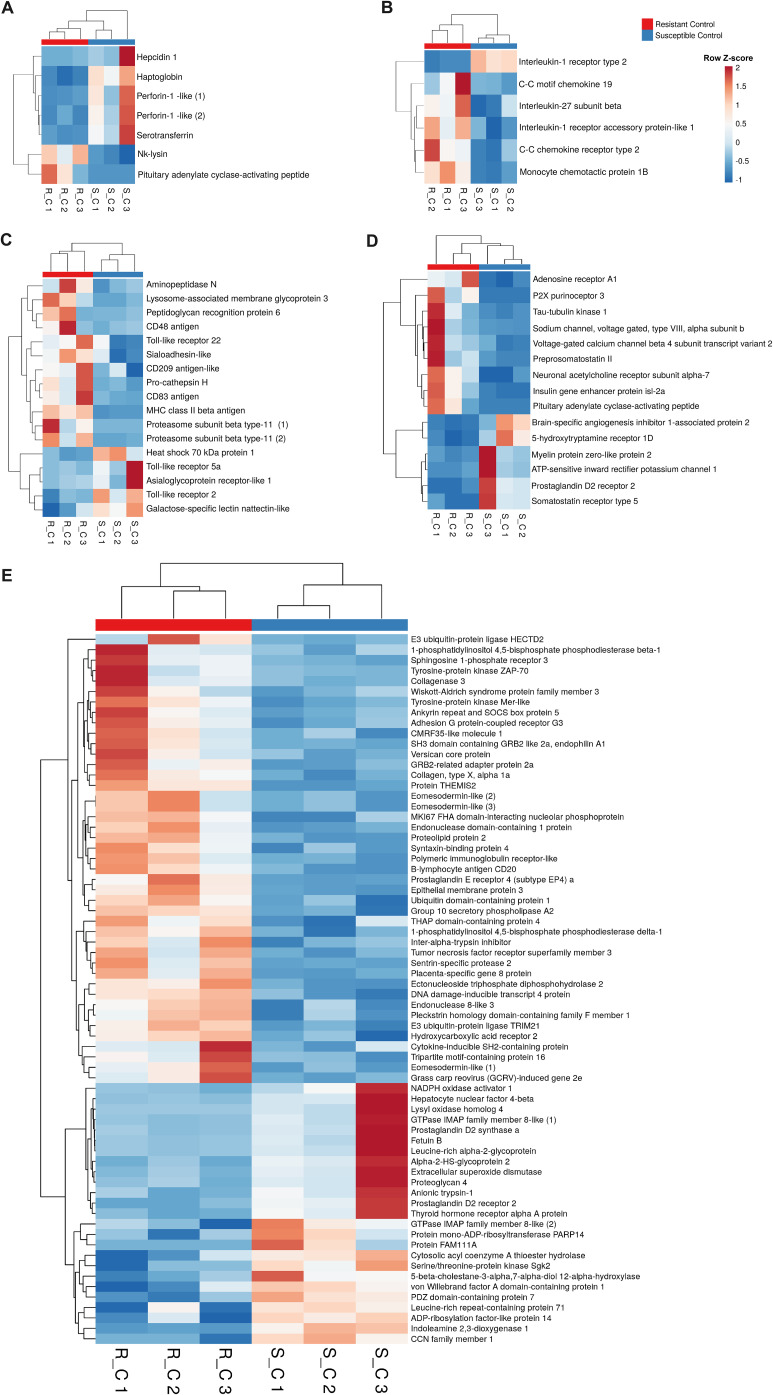
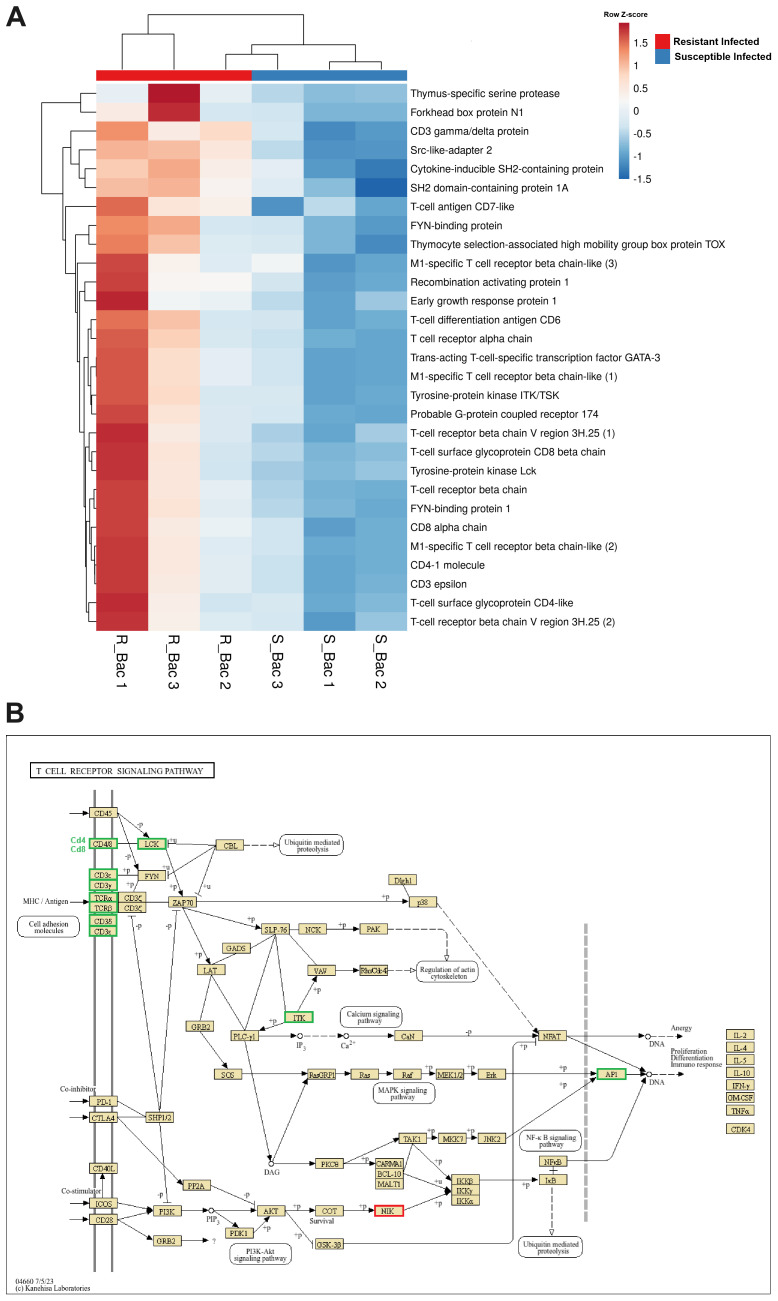
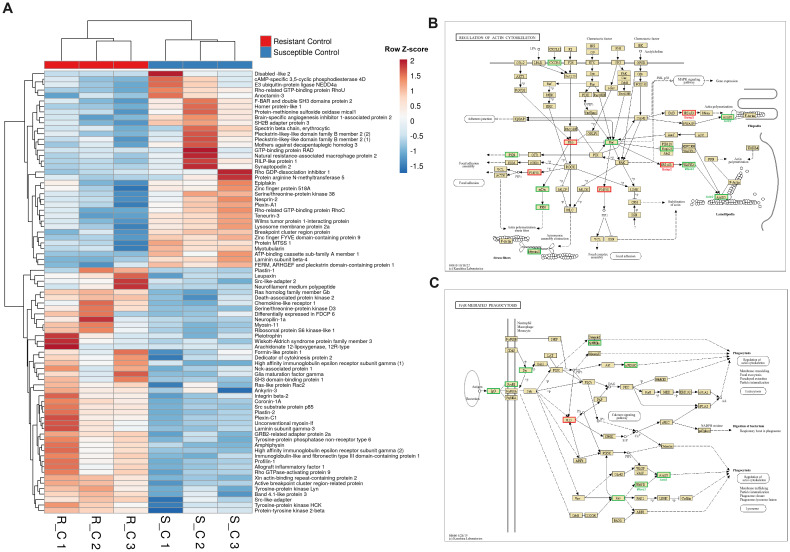
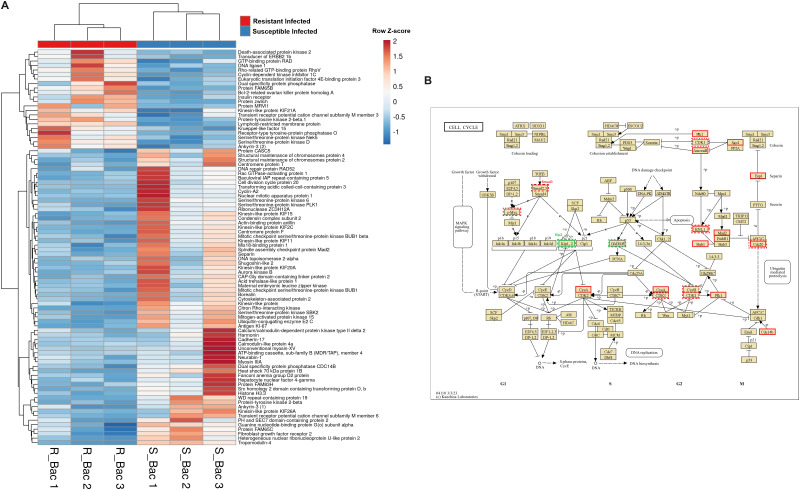
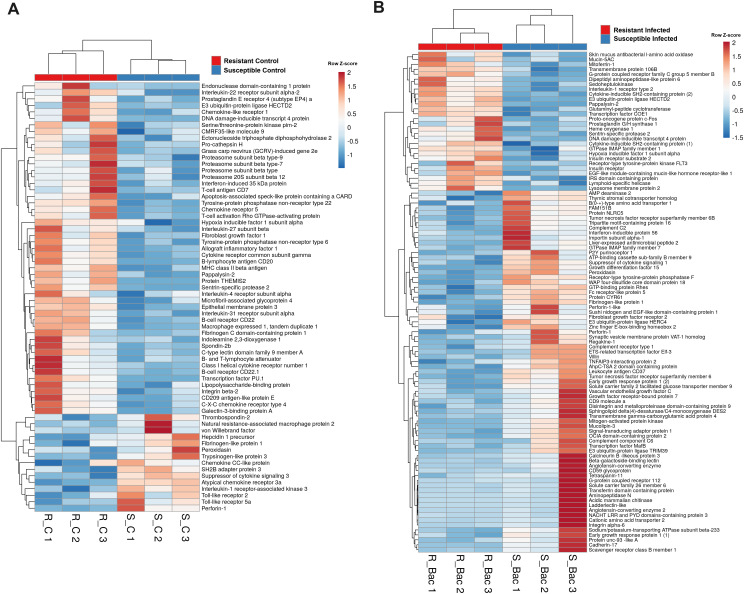
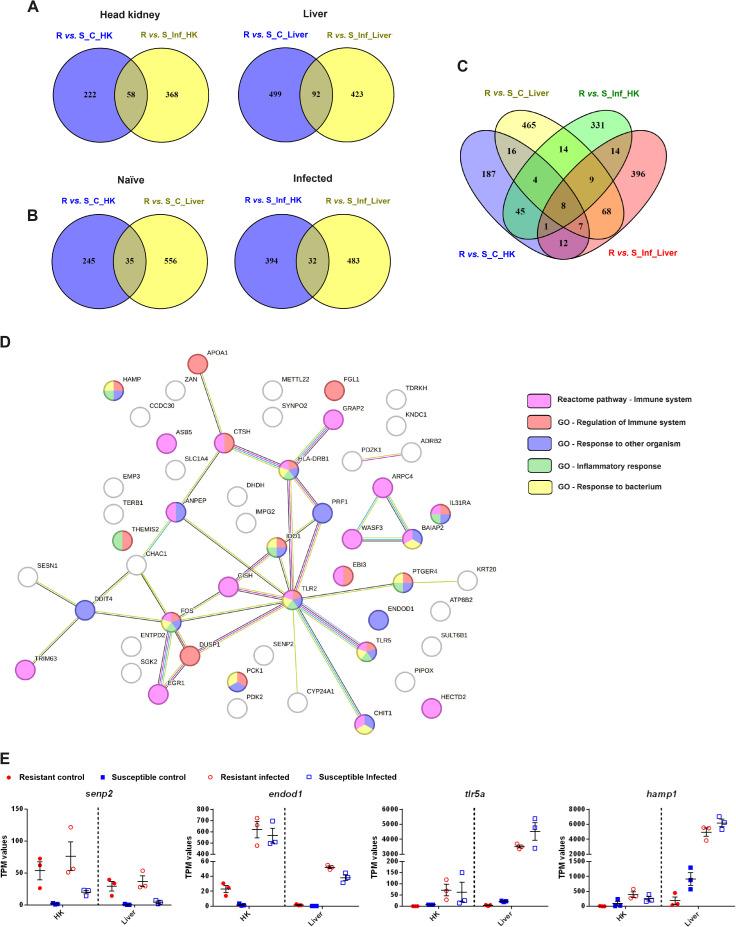
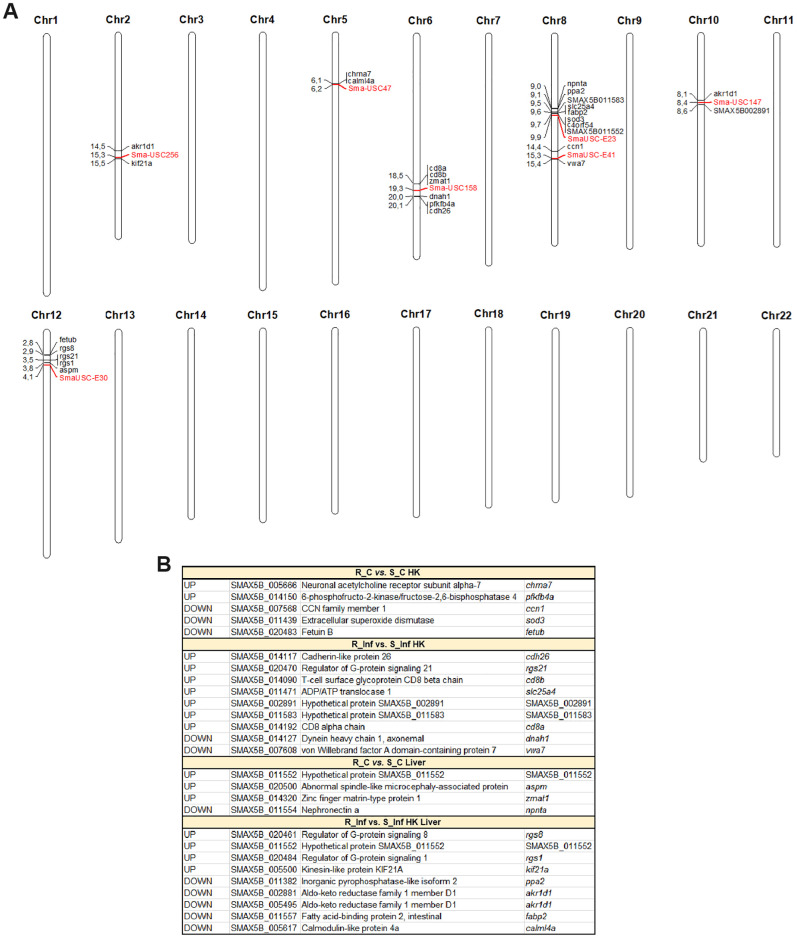
Results: In the absence of infection, differentially expressed genes (DEGs) were identified predominantly in the liver. Following infection, a marked increase in DEGs was observed in the head kidney, with many genes linked to immune functions. Interestingly, the resistant family displayed a more controlled inflammatory response and upregulation of genes related to antigen presentation and T-cell activity in the head kidney at early infection stages, which may have contributed to its increased survival rate. In the liver, transcriptomic differences between the families were associated mainly with cytoskeletal organization, cell cycle regulation, and metabolic processes, including insulin signalling and lipid metabolism, regardless of infection status. Additionally, many DEGs overlapped with previously identified quantitative trait loci (QTLs) associated with resistance to A. salmonicida, providing further insights into the genetic basis of disease resistance.

Discussion: This study represents the first RNA-Seq analysis comparing resistant and susceptible turbot families and contributes valuable knowledge for the development of selective breeding programs targeting disease resistance in turbot and other aquaculture species susceptible to A. salmonicida.

Keywords: Aeromonas salmonicida; disease resistance; furunculosis; transcriptome sequencing; turbot families.


Conflict of interest statement

The authors declare that the research was conducted in the absence of any commercial or financial relationships that could be construed as a potential conflict of interest. The author(s) declared that they were an editorial board member of Frontiers, at the time of submission. This had no impact on the peer review process and the final decision.

Figures

Figure 1
Figure 1
Turbot full-sibling families evaluated for their susceptibility to A. salmonicida subsp. salmonicida. (A) Kaplan−Meier survival curves showing the percent survival of the five families analyzed. Statistically significant differences were determined with a log-rank (Mantel−Cox) test and are displayed as **** (p < 0.0001) or * (0.01 < p < 0.05). (B) qPCR detection of the bacteria A. salmonicida subsp. salmonicida in the head kidney and liver samples from the most resistant and susceptible families. The detection of the bacteria was normalized to the expression of the eef1a gene. The graphs present the means ± SEMs of 4 independent biological replicates. No statistically significant differences were detected between the families.
Figure 2
Figure 2
Overall transcriptome comparison of the resistant and susceptible turbot families under naïve and infected conditions and response to bacterial challenge in each family. Principal component analysis (PCA) of head kidney and liver samples from both families under (A) naïve (uninfected control), (B) A. salmonicida-infected, and (C) all conditions together. (D) Stacked column charts representing the number and intensity (in fold-change value) of the DEGs between the different comparisons in head kidney and liver samples. (E) Venn diagrams showing the number of shared and exclusive DEGs in response to infection with A. salmonicida (24 hpi) between both turbot families. R, resistant; S, susceptible; C, control; I, infected.
Figure 3
Figure 3
GO enrichment analysis (biological processes) of the DEGs in head kidney and liver samples between both turbot families both in the absence and presence of infection. For the liver, only the 30 most significantly enriched terms are represented.
Figure 4
Figure 4
Complement and coagulation genes are differentially expressed in head kidney samples between A. salmonicida-resistant and A. salmonicida-susceptible families. (A) Heatmap and (B) reference KEGG pathways representing the DEGs between both families under naïve conditions and involved in the complement and coagulation cascades. (C) Heatmap and (D) KEGG reference pathway representing the DEGs between both families at 24 hpi and involved in the “complement and coagulation cascades”. In the KEGG pathways, green indicates higher expression, and red indicates lower expression in the resistant family compared to that in the susceptible family.
Figure 5
Figure 5
A variety of immune genes are differentially expressed in head kidney samples between the A. salmonicida-resistant and susceptible families under naïve conditions. In addition to the differences observed in the complement and coagulation pathways in naïve fish, a variety of other immune genes were differentially expressed in the head kidney from both turbot families in the absence of infection. Heatmaps represent the expression (in TPM values) of genes encoding (A) antimicrobial and iron-regulatory molecules, (B) cytokines and cytokine receptors, (C) antigen recognition and presentation-related proteins, (D) neuroimmune molecules, and (E) other immune proteins.
Figure 6
Figure 6
Genes involved in T-cell differentiation, proliferation and activation are expressed at higher levels in the head kidney from the resistant family compared to that from the susceptible family at 24 hpi with A. salmonicida. (A) Heatmap representing the expression (in TPM values) of genes involved in T-cell activity. (B) Reference KEGG pathway representing the DEGs in the “T-cell receptor signalling pathway”. In the KEGG pathway, green indicates higher expression, and red indicates lower expression in the resistant family compared to that in the susceptible family.
Figure 7
Figure 7
Genes involved in cytoskeleton organization are significantly different in liver samples from both turbot families under naïve conditions. (A) Heatmap representing the expression (in TPM values) of genes involved in cytoskeleton organization (including phagocytosis- and chemotaxis-related genes). (B, C) Reference KEGG pathways “Regulation of the actin cytoskeleton” and “FcγR-mediated phagocytosis” representing the DEGs between both turbot families. In the KEGG pathways, green indicates higher expression, and red indicates lower expression in the resistant family compared to that in the susceptible family.
Figure 8
Figure 8
Genes involved in different steps of the cell cycle, such as chromatin condensation, DNA replication, mitotic spindle formation, and cytokinesis, are highly differentially expressed in liver samples from both turbot families at 24 hpi. (A) Heatmap representing the expression (in TPM values) of genes involved in the cell cycle. (B) Reference KEGG pathway “Cell cycle”, which represents the DEGs between both families under naïve and infected conditions. In the KEGG pathways, green indicates higher expression, and red indicates lower expression in the resistant family compared to that in the susceptible family. The dashed line represents the DEGs between both families under naïve conditions, whereas the solid line represents the DEGs between both families at 24 hpi with A. salmonicida.
Figure 9
Figure 9
Heatmap representing the main immune genes differentially expressed in the liver samples from resistant and susceptible turbot families (A) under naïve conditions and (B) at 24 hpi with A. salmonicida.
Figure 10
Figure 10
Certain DEGs between an A. salmonicida-resistant family and an A. salmonicida-susceptible family were differentially expressed both under naïve and infected conditions and in both target tissues (head kidney and liver). (A) Venn diagrams representing the DEGs between both families under naïve and infected conditions. A Venn diagram per tissue is shown. (B) Venn diagrams representing the common and exclusive DEGs between both families in the head kidney and liver. A Venn diagram per experimental condition (naïve or infected) is shown. (C) Venn diagram representing the DEGs between the resistant and susceptible turbot families under both experimental conditions and in both tissues. (D) STRING protein−protein interaction network representing the 59 proteins encoded by the genes commonly differentially expressed between the two families in both tissues (in the absence and/or presence of infection). The genes belonging to the significantly enriched Reactome pathways and GO biological process terms involved in the immune response are highlighted in different colors. (E) Representation of the expression (in TPM values) in the different experimental samples of four of these 59 genes commonly differentially expressed between turbot families in both tissues. The graphs represent the TPM values of the individual samples and the means ± SEMs.
Figure 11
Figure 11
Differentially expressed genes between the resistant and susceptible turbot families (in at least one of the comparisons) located in A. salmonicida resistance QTLs. (A) Locations of the QTL-associated markers (in red color) and the surrounding DEGs (within a window of 2 Mbp upstream and downstream of the marker) on the turbot chromosomes. (B) List of the DEGs for the different comparisons of interest that are located in the vicinity of the QTL-associated markers. R, resistant; S, susceptible; C, control; Inf, infected.

Similar articles

Cited by

References

    1. APROMAR . Aquaculture in Spain 2023(2023). Available online at: https://apromar.es/wp-content/uploads/2023/10/Aquaculture_in_Spain_2023_... (accessed November 27, 2024).
    1. FAO . The state of world fisheries and aquaculture 2022. In: Towards Blue Transformation. FAO, Rome: (2022). doi: 10.4060/cc0461en - DOI
    1. Dallaire-Dufresne S, Tanaka KH, Trudel MV, Lafaille A, Charette SJ. Virulence, genomic features, and plasticity of Aeromonas salmonicida subsp. salmonicida, the causative agent of fish furunculosis. Vet Microbiol. (2014) 169:1–7. doi: 10.1016/j.vetmic.2013.06.025 - DOI - PubMed
    1. Nougayrede P, Sochon E, Vuiiaume A. Isolation of Aeromonas subspecies salmonicida in farmed turbot (Psetta maxima) in France. Bull Eur Assoc Fish Pathol. (1990) 10:139–40.
    1. Toranzo AE, Barja JL. First report of furunculosis in turbot reared in floating cages in Northwest Spain. Bull Eur Ass Fish Pathol. (1992) 12:147–9.

MeSH terms

LinkOut - more resources