. 2024 Dec 6:15:1517312.
doi: 10.3389/fimmu.2024.1517312. eCollection 2024.

Integrative multi-omics analysis reveals a novel subtype of hepatocellular carcinoma with biological and clinical relevance

Affiliations

Integrative multi-omics analysis reveals a novel subtype of hepatocellular carcinoma with biological and clinical relevance

Shizhou Li et al. Front Immunol. .

Abstract

Background: Hepatocellular carcinoma (HCC) is a highly heterogeneous tumor, and the development of accurate predictive models for prognosis and drug sensitivity remains challenging.

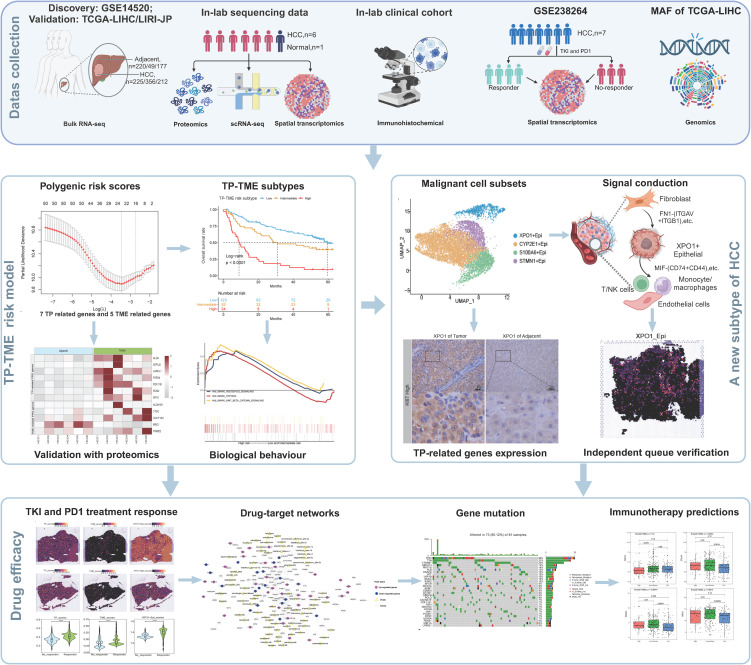
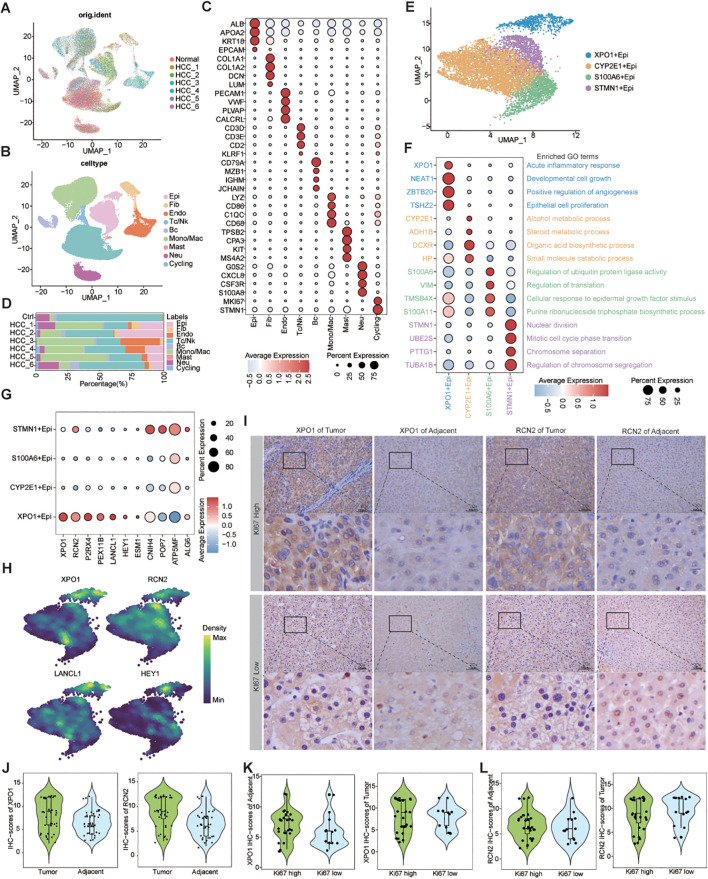
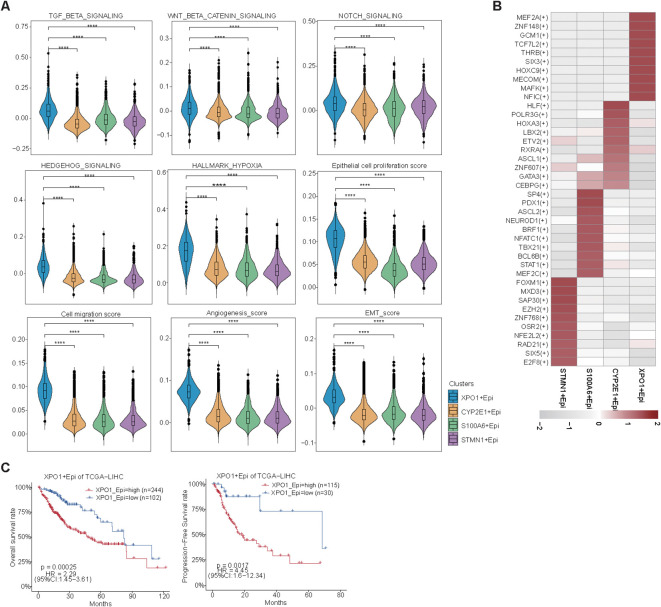
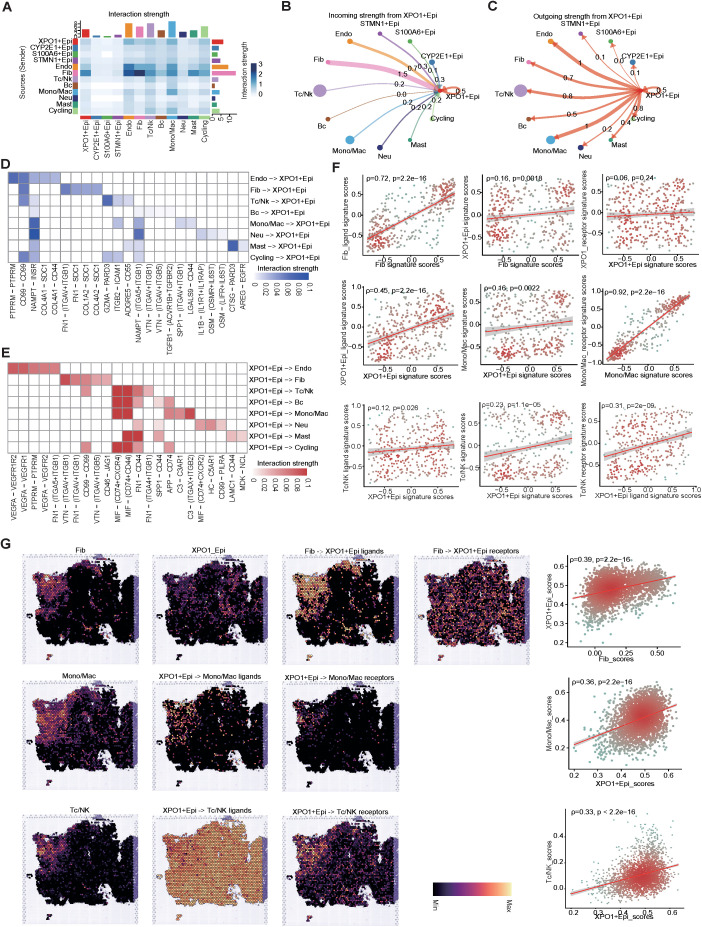
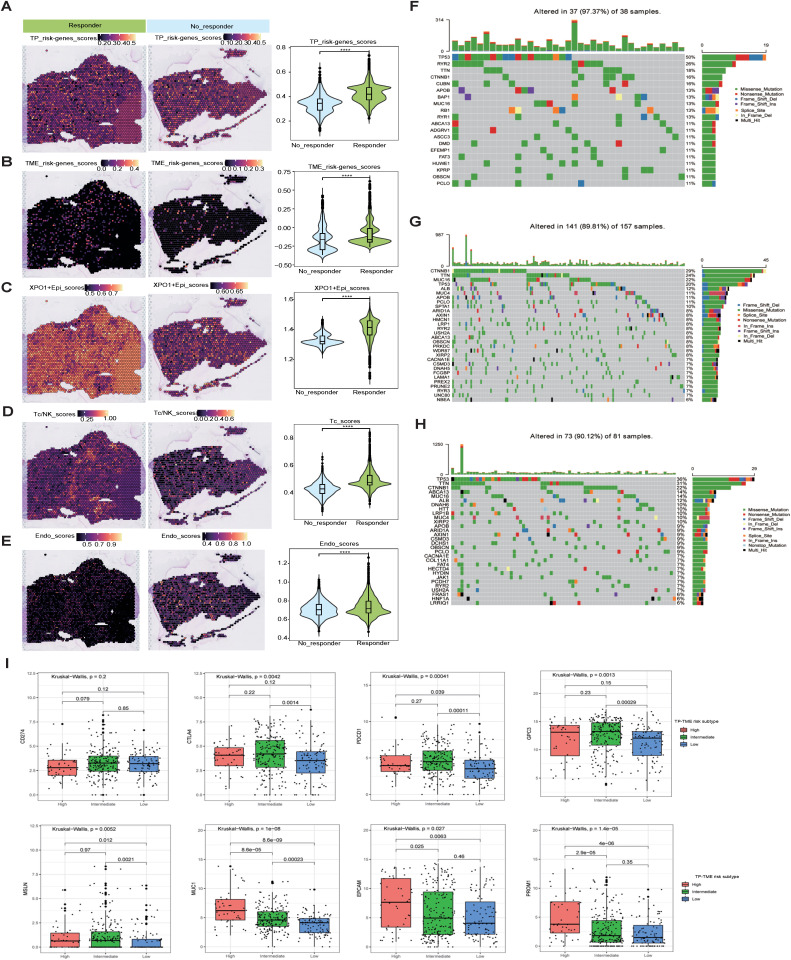
Methods: We integrated laboratory data and public cohorts to conduct a multi-omics analysis of HCC, which included bulk RNA sequencing, proteomic analysis, single-cell RNA sequencing (scRNA-seq), spatial transcriptomics sequencing (ST-seq), and genome sequencing. We constructed a tumor purity (TP) and tumor microenvironment (TME) prognostic risk model. Proteomic analysis validated the TP-TME-related signatures. Joint analysis of scRNA-seq and ST-seq revealed characteristic clusters associated with TP high-risk subtypes, and immunohistochemistry confirmed the expression of key genes. We conducted functional enrichment analysis, transcription factor activity inference, cell-cell interaction, drug efficacy analysis, and mutation information analysis to identify a novel subtype of HCC.

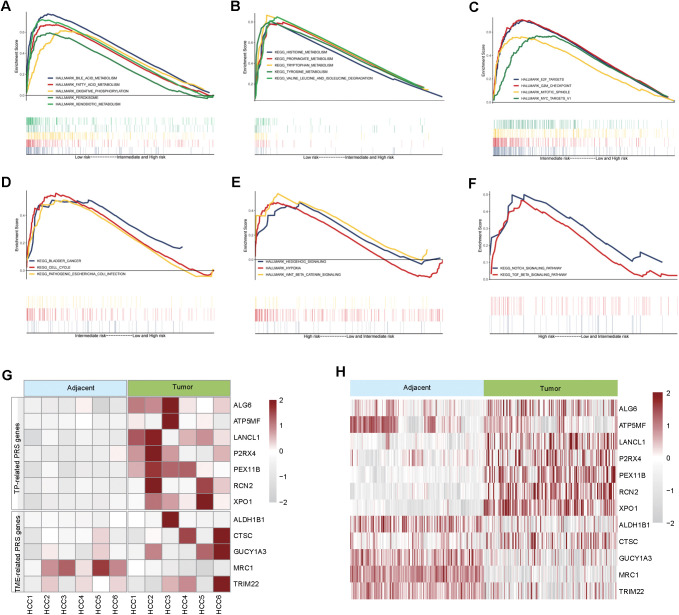
Results: Our analyses constructed a robust HCC prognostic risk prediction model. The patients with TP-TME high-risk subtypes predominantly exhibit hypoxia and activation of the Wnt/beta-catenin, Notch, and TGF-beta signaling pathways. Furthermore, we identified a novel subtype, XPO1+Epithelial. This subtype expresses signatures of the TP risk subtype and aligns with the biological behavior of high-risk patients. Additional analyses revealed that XPO1+Epithelial is influenced primarily by fibroblasts via ligand-receptor interactions, such as FN1-(ITGAV+ITGB1), and constitute a significant component of the TP-TME subtype. Moreover, XPO1+Epithelial interact with monocytes/macrophages, T/NK cells, and endothelial cells through ligand-receptor pairs, including MIF-(CD74+CXCR4), MIF-(CD74+CD44), and VEGFA-VEGFR1R2, respectively, thereby promoting the recruitment of immune-suppressive cells and angiogenesis. The ST-seq cohort treated with Tyrosine Kinase Inhibitors (TKIs) and Programmed Cell Death Protein 1 (PD-1) presented elevated levels of TP and TME risk subtype signature genes, as well as XPO1+Epithelial, T-cell, and endothelial cell infiltration in the treatment response group. Drug sensitivity analyses indicated that TP-TME high-risk subtypes, including sorafenib and pembrolizumab, were associated with sensitivity to multiple drugs. Further exploratory analyses revealed that CTLA4, PDCD1, and the cancer antigens MSLN, MUC1, EPCAM, and PROM1 presented significantly increase expression levels in the high-risk subtype group.

Conclusions: This study constructed a robust prognostic model for HCC and identified novel subgroups at the single-cell level, potentially assisting in the assessment of prognostic risk for HCC patients and facilitating personalized drug therapy.

Keywords: hepatocellular carcinoma; immunotherapy; precision medicine; single-cell RNA sequencing; spatial transcriptomics; tumor microenvironment; tumor purity.


Conflict of interest statement

The authors declare that the research was conducted in the absence of any commercial or financial relationships that could be construed as a potential conflict of interest.

Figures

Figure 1
Figure 1
A flowchart showing the overall idea of this study. The figure was created with biorender.com.
Figure 2
Figure 2
Identification, enrichment analysis, and protein-protein interaction networks of the tumor purity-related genes and tumor microenvironment-related genes in GSE14520_GPL3921. (A) Volcano plot of the differentially expressed genes. (B) Hierarchical clustering showing that the expression patterns of TP-related and TME-related genes basically distinguish HCC and tumor-adjacent liver tissues. (C) Functional enrichment analysis of the TP-related genes. Left panel: GO terms and pathways involving TP-related genes, and right panel: interactions among the GO terms and pathways. (D) Functional enrichment analysis of TME-related genes. Left panel: GO terms and pathways involving TME-related genes, and right panel: interactions among the GO terms and pathways.
Figure 3
Figure 3
Development and validation of TP-TME risk subtypes in GSE14520_GPL3921. (A) Twenty-two TP-related genes had nonzero coefficients in the LASSO Cox regression model analysis; (B) Time-dependent ROC curve analysis for the TP-related PRS; (C) HCC with high TP-related PRS had shorter overall survival than those with low TP-related PRS. (D) Ten TME-related genes had nonzero coefficients in the LASSO Cox regression model analysis; (E) Time-dependent ROC curve analysis for the TME-related polygenic risk score; (F) HCC with high TME-related PRS had shorter overall survival than those with low TME-related PRS. (G) There were significant differences in overall survival among the three subtypes of the TP-TME risk subtypes. (H) There were significantly differences in progression-free survival among the three subtypes of the TP-TME risk subtypes. (I) The TP-TME risk subtype system was proven to be an independent prognostic factor, after adjusting for other clinicopathological characteristics.
Figure 4
Figure 4
Biological behavior and characteristic gene protein expression levels of TP-TME risk subtypes. (A) The hallmark gene sets enriched in the TP-TME low-risk subtype. (B) The KEGG pathway gene sets enriched in the TP-TME low-risk subtype. (C) The hallmark gene sets enriched in the TP-TME intermediate-risk subtype. (D) The KEGG pathway gene sets enriched in the TP-TME intermediate-risk subtype. (E) The hallmark gene sets enriched in the TP-TME high-risk subtype. (F) The KEGG pathway gene sets enriched in the TP-TME high-risk subtype. (G) Heatmap showing the protein expression levels of genes associated with the TP-TME risk subtypes. (H) Heatmap showing protein expression levels of genes associated with the TP-TME risk subtypes reported by Gao et al.
Figure 5
Figure 5
Single-cell resolution exploration of the expression profiles of genes characterizing TP-TME risk subtypes in HCC. (A) UMAP plot illustrating the distribution of cells across different samples, with distinct colors representing each sample; (B) UMAP plot depicting the transcriptomic landscape of 62,163 high-quality cells across nine cell types, with different colors indicating the various cell types: Epi (epithelial cell), Fib (fibroblast cell), Endo (endothelial cell), Tc/NK (T cell/natural killer cell), Bc (B cell), Mono/Mac (monocyte/macrophage cell), Mast (mast cell), Neu (neutrophil cell), and Cycling (cycling cell). (C) Bubble plots displaying the percentage expression of classical marker genes across the nine cell types, alongside average expression levels. (D) Bar graph illustrating the distribution of the nine cell types across different tissues, color-coded by cell type. (E) UMAP plot showing the cluster of epithelial cells divided into four distinct cell clusters. (F) Bubble plots highlighting the percentage and average expression levels of genes with high expression specific to different epithelial cell clusters, as well as GO-BP functional enrichment. (G) Bubble plots presenting the expression percentages and average expression levels of genes characterizing the TP risk subtype across different epithelial cell clusters. (H) Density map illustrating the distribution of TP-related genes within epithelial cell clusters. (I) IHC staining of XPO1 and RCN2 in clinical samples from HCC adjacent and tumor tissues. (J) Violin plot demonstrating the statistical analysis of IHC scores for XPO1 and RCN2 genes. (K, L) Violin plots displaying IHC scoring statistics for XPO1 (K) and RCN2 (L) under varying levels of Ki67 expression.
Figure 6
Figure 6
Biological function scoring and survival analysis of epithelial cells. (A) Violin plots illustrating various epithelial cell clusters in relation to TGF-beta signaling, Wnt beta/catenin signaling, Notch signaling, Hedgehog signaling, hypoxia, epithelial cell proliferation, cell migration, angiogenesis, and EMT scores. The Wilcoxon test was employed to evaluate the differences between groups. Statistical significance is indicated by ‘****’, corresponding to P < 0.0001, respectively. (B) Heatmap displaying the top 10 transcription factors with the highest activity across different epithelial cell clusters. (C) A line graph depicting the overall survival and progression-free survival of XPO1+ epithelial cells.
Figure 7
Figure 7
Cell-cell interaction network of HCC epithelial cells. (A) Heatmap illustrating the interaction intensities among various cell types in HCC. (B, C) Circular plot depicting the interaction intensities of incoming (B) and outgoing (C) interactions involving XPO1+Epithelial. (D, E) Heatmaps demonstrating the enhancement of ligand-receptor interaction intensities between XPO1+Epithelial and other cell types, with (D) focusing on incoming interactions and (E) on outgoing interactions. (F) A scatter plot revealing the correlation between XPO1+Epithelial and fibroblasts, monocytes/macrophages, and T/NK cells, along with their associated ligand receptors within the TCGA-LIHC cohort (n=374). (G) ST-seq was used to assess the spatial distribution and correlation between XPO1+Epithelial, fibroblasts, monocytes/macrophages, T/NK cells, and their interacting ligand receptors in HCC.
Figure 8
Figure 8
Mutation, stemness, and immunotherapeutic efficacy analysis. (A–E) Spatial transcriptomics data (GSE238264) reveal genes associated with TP risk profiles (A), genes linked to TME risk profiles (B), the spatial distribution of XPO1+Epi (C), T/NK cells (D), and endothelial cells (E), and their statistical quantification in patients who either responded or did not respond to TKIs in combination with PD1 therapy. The Wilcoxon test was employed to evaluate differences between groups, with significance levels indicated as follows: ‘****’, corresponding to P<0.0001, respectively. (F–H) Violin plots illustrating the top 30 mutated genes across three risk subtypes: (F) TP-TME high-risk subtype, (G) TP-TME intermediate-risk subtype, and (H) TP-TME low-risk subtype. (I) The expression levels of CD274, CTLA4, PDCD1, GPC3, MSLN, MUC1, EPCAM, and PROM1 are presented across the three TP-TME risk subtypes.

References

    1. Siegel RL, Giaquinto AN, Jemal A. Cancer statistics, 2024. CA Cancer J Clin. (2024) 74:12–49. doi: 10.3322/caac.21820 - DOI - PubMed
    1. Forner A, Reig M, Bruix J. Hepatocellular carcinoma. Lancet. (2018) 391:1301–14. doi: 10.1016/S0140-6736(18)30010-2 - DOI - PubMed
    1. Caruso S, Calatayud AL, Pilet J, La Bella T, Rekik S, Imbeaud S, et al. Analysis of liver cancer cell lines identifies agents with likely efficacy against hepatocellular carcinoma and markers of response. Gastroenterology. (2019) 157:760–76. doi: 10.1053/j.gastro.2019.05.001 - DOI - PubMed
    1. de Bono JS, Ashworth A. Translating cancer research into targeted therapeutics. Nature. (2010) 467:543–9. doi: 10.1038/nature09339 - DOI - PubMed
    1. Losic B, Craig AJ, Villacorta-Martin C, Martins-Filho SN, Akers N, Chen X, et al. Intratumoral heterogeneity and clonal evolution in liver cancer. Nat Commun. (2020) 11:291. doi: 10.1038/s41467-019-14050-z - DOI - PMC - PubMed

MeSH terms

Substances