. 2024 Dec 6:15:1507476.
doi: 10.3389/fimmu.2024.1507476. eCollection 2024.

Exploring the heterogeneity of osteosarcoma cell characteristics and metabolic states and their association with clinical prognosis

Affiliations

Exploring the heterogeneity of osteosarcoma cell characteristics and metabolic states and their association with clinical prognosis

Sen Qin et al. Front Immunol. .

Abstract

Background: Osteosarcoma is a malignant tumor originating from mesenchymal bone tissue, characterized by high malignancy and poor prognosis. Despite progress in comprehensive treatment approaches, the five-year survival rate remains largely unchanged, highlighting the need to clarify its underlying mechanisms and discover new therapeutic targets.

Methods: This study utilized RNA sequencing data from multiple public databases, encompassing osteosarcoma samples and healthy controls, along with single-cell RNA sequencing data. Various methods were utilized, such as differential expression analysis of genes, analysis of metabolic pathways, and weighted gene co-expression network analysis (WGCNA), to pinpoint crucial genes. Using this list of genes, we developed and validated a prognostic model that incorporated risk signatures, and we evaluated the effectiveness of the model through survival analysis, immune cell infiltration examination, and drug sensitivity evaluation.

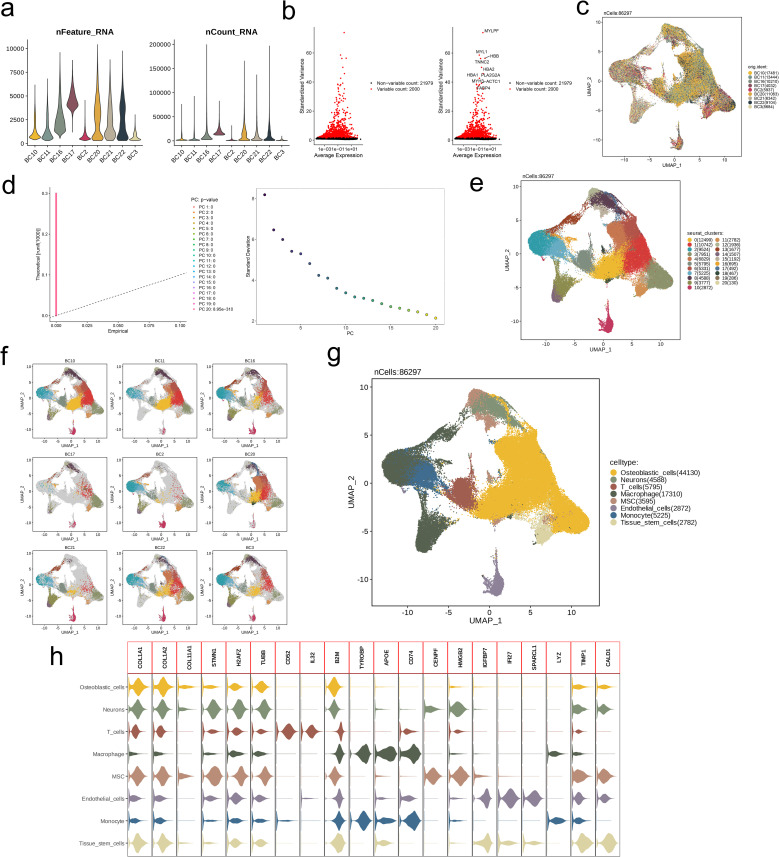
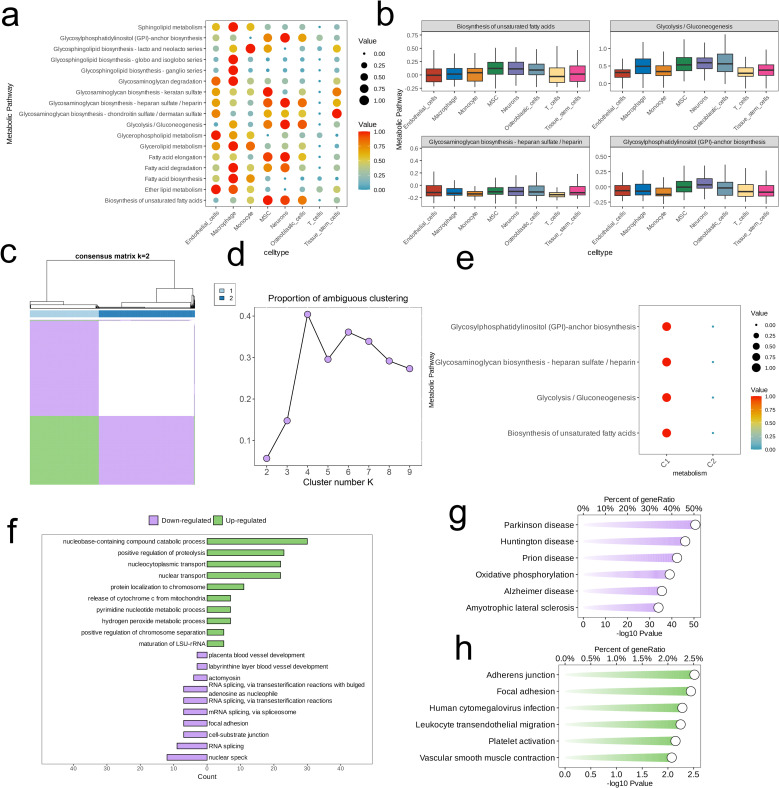
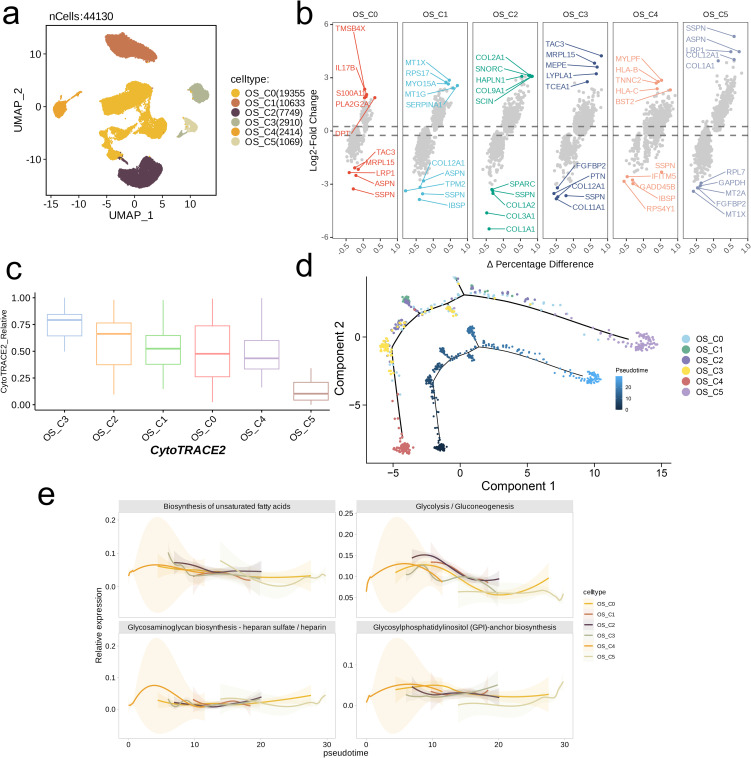
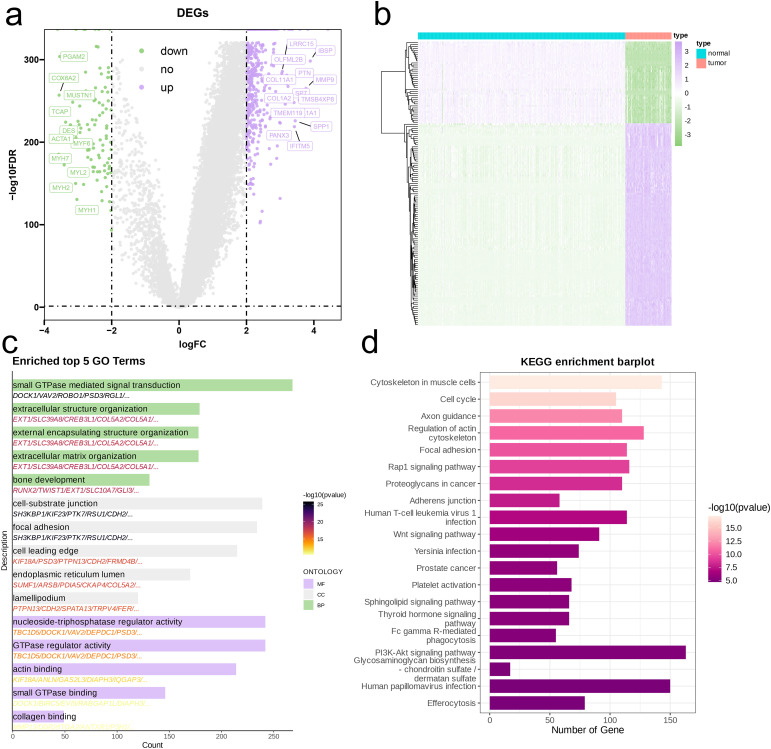
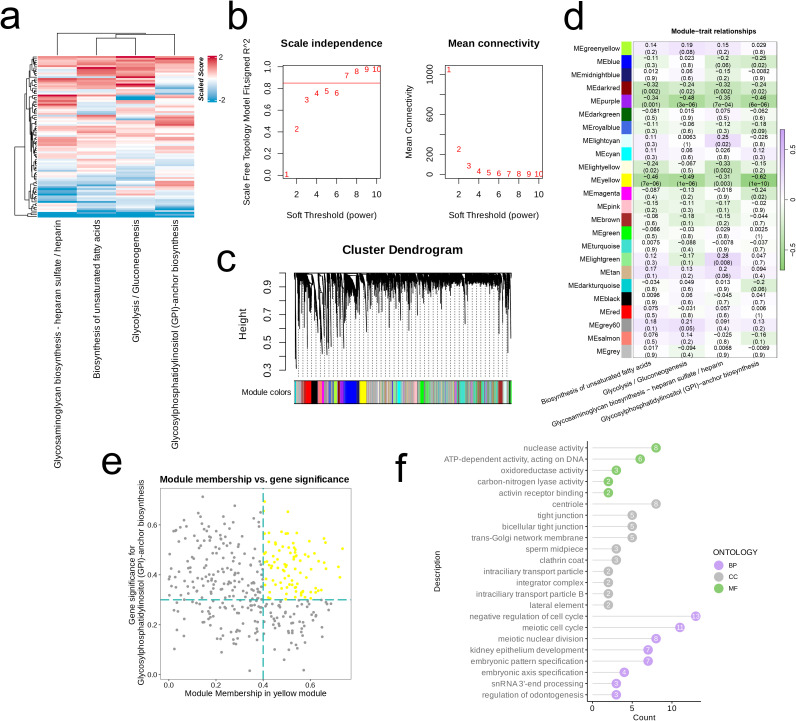
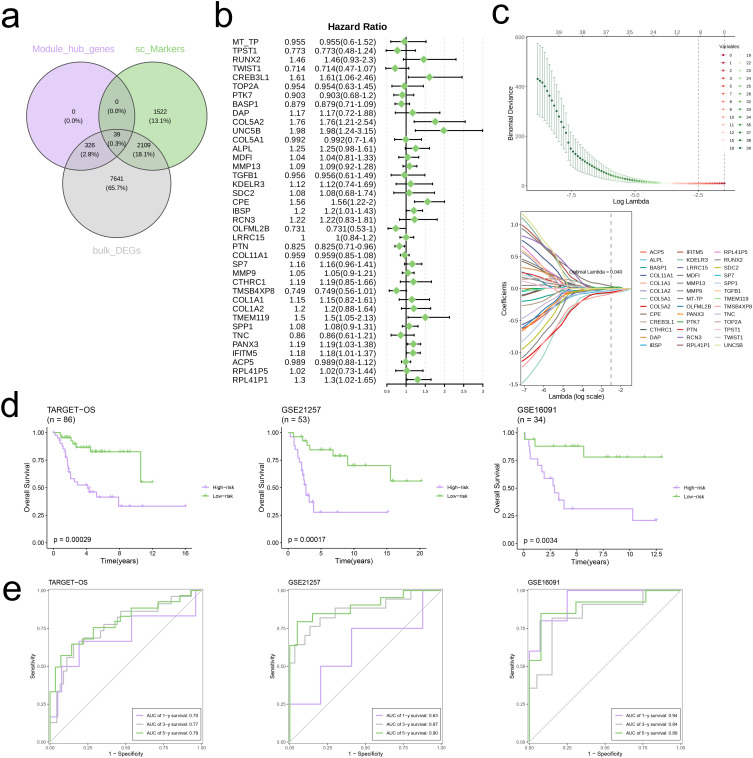
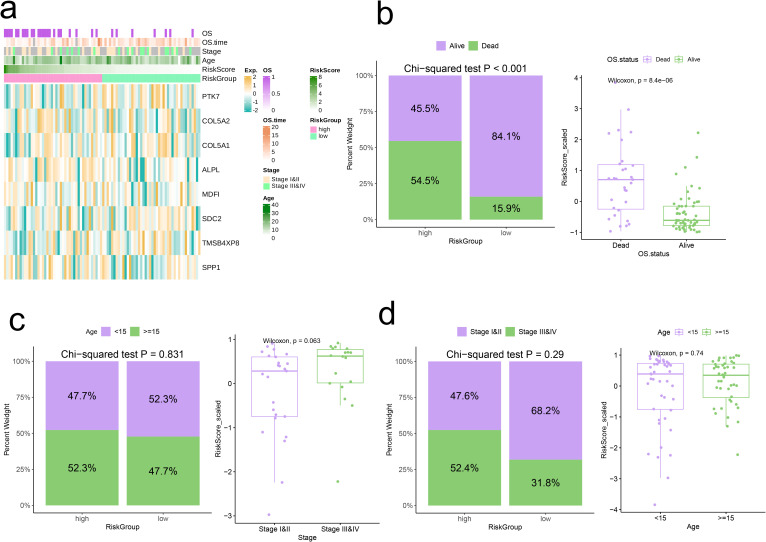
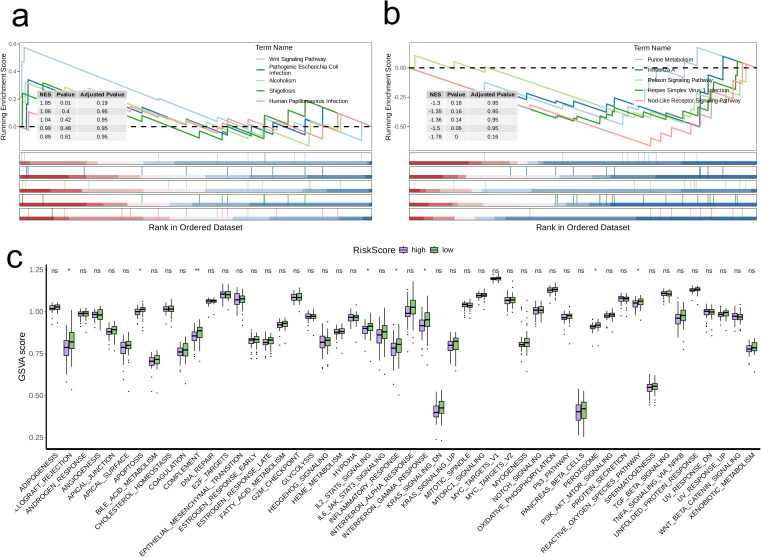
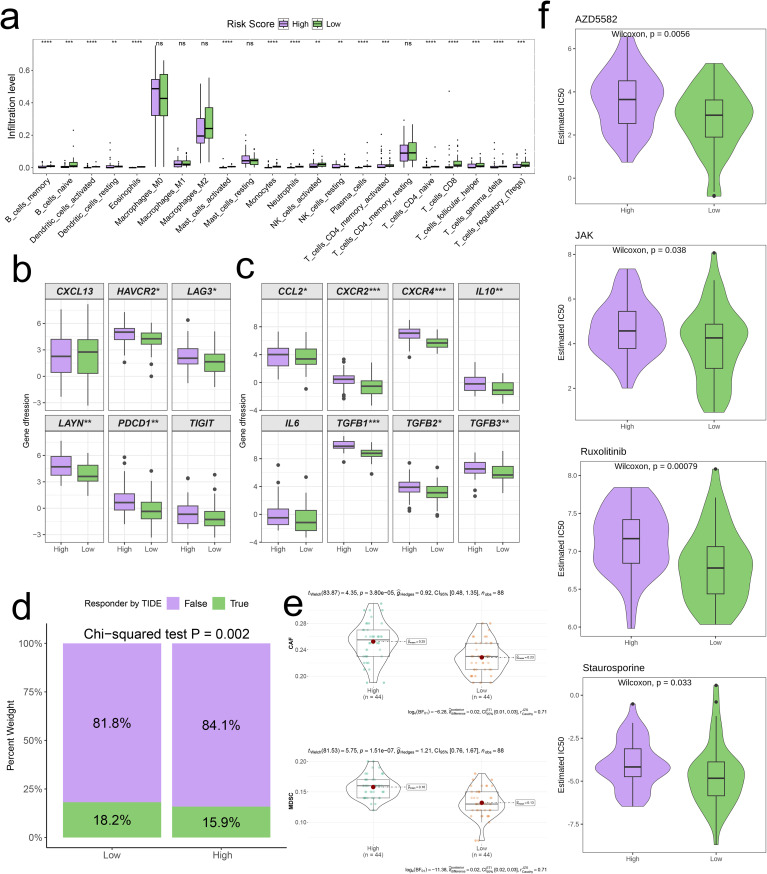
Results: We analyzed gene expression and metabolic pathways in nine samples using single-cell sequencing data. Initially, we performed quality control and clustering, identifying 21 statistically significant cell subpopulations. Metabolic analyses of these subpopulations revealed heterogeneous activation of metabolic pathways. Focusing on the osteoblastic cell subpopulation, we further subdivided it into six groups and examined their gene expression and differentiation capabilities. Differential expression and enrichment analyses indicated that tumor tissues were enriched in cytoskeletal and structural pathways. Through WGCNA, we identified core genes negatively correlated with four highly activated metabolic pathways. Using osteosarcoma patient data, we developed a risk signature model that demonstrated robust prognostic predictions across three independent cohorts. Ultimately, we performed a thorough examination of the model, which encompassed clinical and pathological characteristics, enrichment analysis, pathways associated with cancer markers, and scores of immune infiltration, highlighting notable and complex disparities between high-risk and low-risk populations.

Conclusion: This research clarifies the molecular mechanisms and metabolic features associated with osteosarcoma and how they relate to patient outcomes, offering novel perspectives and approaches for targeted therapy and prognostic assessment in osteosarcoma.

Keywords: comprehensive analysis; immune infiltration; metabolic pathways; osteosarcoma; prognostic analysis.


Conflict of interest statement

The authors declare that the research was conducted in the absence of any commercial or financial relationships that could be construed as a potential conflict of interest.

Figures

Figure 1
Figure 1
Identification of 8 cell clusters with diverse annotations revealing high cellular heterogeneity in OS based on single-cell RNA-seq data. (A) After quality control of scRNA-seq, 86297 core cells were identified. (B) The variance diagram shows the variation of gene expression in all cells of OS. The red dots represent highly variable genes and the black dots represent non-variable genes. (C) UMAP showed a clear separation of cells in OS. (D) PCA identified the top 20 PCs at p<0.05. (E) The umap algorithm was applied to the top 20 PCs for dimensionality reduction, and 21 cell clusters were successfully classified. (F) Classification of cell clusters in each sample. (G) All 8 cell clusters in OS were annotated with SingleR and CellMarker according to the composition of marker genes. (H) Expression levels of marker genes for each cell cluster.
Figure 2
Figure 2
Identification of cell clusters with highly activated metabolism activities in OS at the single cell level. (A) The highly activated metabolic process of in each cell cluster revealed by the “scMetabolism” R package. (B) Boxplots showing the activities of four highly activated metabolic pathways in osteoblastic cells. (C) Consensus matrix(k=2). (D) The proportion of ambiguous clustering (PAC) score, a low value of PAC implies a flat middle segment, allowing conjecture of the optimal k (k = 2) by the lowest PAC. (E) Two distinct metabolism patterns of OS at the single-cell level unraveled by the unsupervised clustering. (F–H) Barplot reveals the dysregulated GO-BP terms (F) and KEGG pathways (G, H) in OS cells with highly activated metabolism activities.
Figure 3
Figure 3
Trajectory analysis of OS cell subsets with distinct differentiation patterns. (A) UMAP visualization of the subsets of osteoblastic cells. (B) Volcano plots showing the celltype-specific markers of each subset. (C) Boxplots showing the predicted cellular potency and absolute developmental potential of osteoblastic cell subset. (D) Trajectory analysis revealed cell subsets of osteoblastic cells with distinct differentiation states. (E) The variations of metabolic pathway activities along with the pseudotime.
Figure 4
Figure 4
Identification and functional enrichment analysis of DEGs between OS patients and controls. (A) Volcano plot of DEGs between OS and control in the merged cohort of TARGET-OS and GTEx. P<0.05 and |log2FoldChange|>1 were identified as significant DEGs. (B) b Heatmap of DEGs. (C, D) Barplots of the BP, CC, MF (C), and KEGG pathways (D) of DEGs.
Figure 5
Figure 5
Metabolism-related genes were screened by WGCNA. (A) Heatmap of the four highly activated metabolic pathways. (B) Analysis of the scale-free index for various soft-threshold powers (β). (C) Cluster dendrogram of the coexpression modules. Each color indicates a co-expression module. (D) Module-trait heatmap displaying the correlation between module eigengenes and clinical traits. (E) Correlation between module membership and gene significance in the yellow modules. Dots in colors were regarded as the hub genes of the module. (F) The top enriched GO terms of the hub genes of the module.
Figure 6
Figure 6
Construction of risk signature in the TARGET-OS cohort. (A) Venn diagram analysis of hub genes of modules, single-cell markers, and DEGs from TARGET-OS bulk cohort. (B) Univariate cox regression analysis of 39 genes in TARGET-OS cohort. (C) The selection of prognostic genes based on the optimal parameter λ that was obtained in the LASSO regression analysis. (D) K-M curves displayed survival outcomes of patients in two risk groups from the three cohorts. (E) Time-dependent ROC curves were drawn to assess survival rate at 1-year, 3-year, and 5-year in the three cohort.
Figure 7
Figure 7
Correlation analysis of risk scores with clinical characteristics. (A) Heatmap of risk model and clinical characteristics. (B-D) Relationship between age, stage, and survival status with the analysis model.
Figure 8
Figure 8
Biological characteristics between high-and low-risk groups. (A, B) The upregulated (A) and downregulated (B) KEGG pathways in high-risk group. (C) The differences of estimated GSVA scores of cancer hallmarks between high- and low-risk groups.
Figure 9
Figure 9
Distinct TME landscapes and therapeutic agents between high-and low-risk groups. (A) Box plot illustrating the distributions of 22 immune cell subsets determined by CIBERSORT between two risk groups. (B, C) Box plot illustrating the expression profiles of T cell exhaustion markers (B) and M2 polarization regulators (C) between two risk groups. (D) Stacked plot showed the distribution of predicted responders determined by the TIDE webtool between two risk groups. (E) Violin plot displaying the infiltration levels of CAF and MDSC between two risk groups. (F) Violin plot displaying the estimated IC50 of therapeutic agents between two risk groups.
Figure 10
Figure 10
The effect of COL5A1 on osteosarcoma was verified by wet experiment. (A) Comparison of mRNA expression levels of COL5A1 between cell lines. (B) Evaluation of COL5A1 knockdown efficiency. (C) Changes in proliferation levels after COL5A1 knockdown in MG63 cell lines. (D) Changes in proliferation levels after COL5A1 knockdown in SAOS2 cell lines.

Similar articles

References

    1. Yu L, Chen Y, Yuan S, Cao Y, Bi Z. Peiminine induces G0/G1-phase arrest, apoptosis, and autophagy via the ROS/JNK signaling pathway in human osteosarcoma cells in vitro and in vivo. Front Pharmacol. (2021) 12:770846. doi: 10.3389/fphar.2021.770846 - DOI - PMC - PubMed
    1. Liao J, Shi K, Jia Y, Wu Y, Qian Z. Gold nanorods and nanohydroxyapatite hybrid hydrogel for preventing bone tumor recurrence via postoperative photothermal therapy and bone regeneration promotion. Bioact Mater. (2021) 6:2221–30. doi: 10.1016/j.bioactmat.2021.01.006 - DOI - PMC - PubMed
    1. Zhao J, Pan B, Zhou X, Wu C, Hao F, Zhang J, et al. . Polygonum cuspidatum inhibits the growth of osteosarcoma cells via impeding Akt/ERK/EGFR signaling pathways. Bioengineered. (2022) 13:2992–3006. doi: 10.1080/21655979.2021.2017679 - DOI - PMC - PubMed
    1. Li S, Pei Y, Wang W, Liu F, Zheng K, Zhang X. Circular RNA 0001785 regulates the pathogenesis of osteosarcoma as a ceRNA by sponging miR-1200 to upregulate HOXB2. Cell Cycle. (2019) 18:1281–91. doi: 10.1080/15384101.2019.1618127 - DOI - PMC - PubMed
    1. Gokulnath P, de Cristofaro T, Manipur I, Di Palma T, Soriano AA, Guarracino MR, et al. . Long non-coding RNA HAND2-AS1 acts as a tumor suppressor in high-grade serous ovarian carcinoma. Int J Mol Sci. (2020) 21. doi: 10.3390/ijms21114059 - DOI - PMC - PubMed

MeSH terms

Substances

LinkOut - more resources