Common diagnostic biomarkers and molecular mechanisms of Helicobacter pylori infection and inflammatory bowel disease
- PMID: 39712025
- PMCID: PMC11659760
- DOI: 10.3389/fimmu.2024.1492810
Common diagnostic biomarkers and molecular mechanisms of Helicobacter pylori infection and inflammatory bowel disease
Abstract
Background: Helicobacter pylori (H. pylori) may be present in the intestinal mucosa of patients with inflammatory bowel disease (IBD), which is a chronic inflammation of the gastrointestinal tract. The role of H. pylori in the pathogenesis of IBD remains unclear. In this study, bioinformatics techniques were used to investigate the correlation and co-pathogenic pathways between H. pylori and IBD.
Methods: The following matrix data were downloaded from the GEO database: H. pylori-associated gastritis, GSE233973 and GSE27411; and IBD, GSE3365 and GSE179285. Differential gene analysis was performed via the limma software package in the R environment. A protein-protein interaction (PPI) network of DEGs was constructed via the STRING database. Cytoscape software, through the CytoHubba plugin, filters the PPI subnetwork and identifies Hub genes. Validation of the Hub genes was performed in the validation set. Immune analysis was conducted via the CIBERSORT algorithm. Transcription factor interaction and small molecule drug analyses of the Hub genes were also performed.
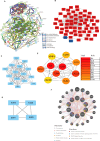
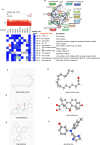
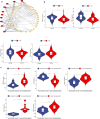
Results: Using the GSE233973 and GSE3365 datasets, 151 differentially expressed genes (DEGs) were identified. GO enrichment analysis revealed involvement in leukocyte migration and chemotaxis, response to lipopolysaccharides, response to biostimulatory stimuli, and regulation of interleukin-8 (IL-8) production. Ten Hub genes (TLR4, IL10, CXCL8, IL1B, TLR2, CXCR2, CCL2, IL6, CCR1 and MMP-9) were identified via the PPI network and Cytoscape software. Enrichment analysis of the Hub genes focused on the lipopolysaccharide response, bacterial molecular response, biostimulatory response and leukocyte movement. Validation using the GSE27411 and GSE179285 datasets revealed that MMP-9 was significantly upregulated in both the H. pylori and IBD groups. The CIBERSORT algorithm revealed immune infiltration differences between the control and disease groups of IBD patients. Additionally, the CMap database identified the top 11 small molecule compounds across 10 cell types, including TPCA-1, AS-703026 and memantine, etc.
Conclusion: Our study revealed the co-pathogenic mechanism between H. pylori and IBD and identified 10 Hub genes related to cellular immune regulation and signal transduction. The expression of MMP-9 is significantly upregulated in both H. pylori infection and IBD. This study provides a new perspective for exploring the prevention and treatment of H. pylori infection and IBD.
Keywords: Helicobacter pylori; bioinformatics analysis; diagnostic biomarkers; inflammatory bowel disease; molecular mechanism.
Copyright © 2024 Zhang, Liu, Luo, Zhang, Chen, Wang and Xie.
Conflict of interest statement
The authors declare that the research was conducted in the absence of any commercial or financial relationships that could be construed as a potential conflict of interest.
Figures


Similar articles
-
Potential shared pathogenic mechanisms between endometriosis and inflammatory bowel disease indicate a strong initial effect of immune factors.Front Immunol. 2024 Apr 3;15:1339647. doi: 10.3389/fimmu.2024.1339647. eCollection 2024. Front Immunol. 2024. PMID: 38660311 Free PMC article.
-
Exploring the common mechanism of vascular dementia and inflammatory bowel disease: a bioinformatics-based study.Front Immunol. 2024 Apr 25;15:1347415. doi: 10.3389/fimmu.2024.1347415. eCollection 2024. Front Immunol. 2024. PMID: 38736878 Free PMC article.
-
Exploring a shared genetic signature and immune infiltration between spontaneous intracerebral hemorrhage and Helicobacter pylori infection.Microb Pathog. 2023 May;178:106067. doi: 10.1016/j.micpath.2023.106067. Epub 2023 Mar 11. Microb Pathog. 2023. PMID: 36914055
-
Role of gut microbiota and Helicobacter pylori in inflammatory bowel disease through immune-mediated synergistic actions.World J Gastroenterol. 2024 Dec 21;30(47):5097-5103. doi: 10.3748/wjg.v30.i47.5097. World J Gastroenterol. 2024. PMID: 39713161 Free PMC article. Review.
-
Applications of proteomics in the study of inflammatory bowel diseases: Current status and future directions with available technologies.Inflamm Bowel Dis. 2009 Apr;15(4):616-29. doi: 10.1002/ibd.20652. Inflamm Bowel Dis. 2009. PMID: 18844215 Free PMC article. Review.
Cited by
-
Identification and validation of oxidative stress signature genes in the trabecular meshwork of glaucoma.Sci Rep. 2025 Aug 25;15(1):31260. doi: 10.1038/s41598-025-16534-z. Sci Rep. 2025. PMID: 40855175 Free PMC article.
-
Biological characteristics, immune infiltration and drug prediction of PANoptosis related genes and possible regulatory mechanisms in inflammatory bowel disease.Sci Rep. 2025 Jan 15;15(1):2033. doi: 10.1038/s41598-024-84911-1. Sci Rep. 2025. PMID: 39814753 Free PMC article.
References
MeSH terms
Substances
LinkOut - more resources
Full Text Sources
Medical
Research Materials
Miscellaneous

