. 2024 Dec;18(6):3309-3325.
doi: 10.1007/s11571-023-09983-7. Epub 2023 Jun 20.

Single-trial neurodynamics reveal N400 and P600 coupling in language comprehension

Affiliations

Single-trial neurodynamics reveal N400 and P600 coupling in language comprehension

Christoph Aurnhammer et al. Cogn Neurodyn. 2024 Dec.

Abstract

Theories of the electrophysiology of language comprehension are mostly informed by event-related potential effects observed between condition averages. We here argue that a dissociation between competing effect-level explanations of event-related potentials can be achieved by turning to predictions and analyses at the single-trial level. Specifically, we examine the single-trial dynamics in event-related potential data that exhibited a biphasic N400-P600 effect pattern. A group of multi-stream models can explain biphasic effects by positing that each individual trial should induce either an N400 increase or a P600 increase, but not both. An alternative, single-stream account, Retrieval-Integration theory, explicitly predicts that N400 amplitude and P600 amplitude should be correlated at the single-trial level. In order to investigate the single-trial dynamics of the N400 and the P600, we apply a regression-based technique in which we quantify the extent to which N400 amplitudes are predictive of the electroencephalogram in the P600 time window. Our findings suggest that, indeed, N400 amplitudes and P600 amplitudes are inversely correlated within-trial and, hence, the N400 effect and the P600 effect in biphasic data are driven by the same trials. Critically, we demonstrate that this finding also extends to data which exhibited only monophasic effects between conditions. In sum, the observation that the N400 is inversely correlated with the P600 on a by-trial basis supports a single stream view, such as Retrieval-Integration theory, and is difficult to reconcile with the processing mechanisms proposed by multi-stream models.

Keywords: ERPs; Language Comprehension; N400; Neurolinguistics; P600; Single-trial analysis.


Conflict of interest statement

Conflict of interestThe authors have no competing interests to declare.

Figures

Fig. 1
Fig. 1
Schematic overview of the multi-stream explanation of N400 and P600 increases. Stimuli are examples from two conditions in Hoeks et al. (2004). Predicted N400 and P600 increases are specified relative to the baseline condition (“the javelin was by the athletes thrown”). Hoeks et al. (2004) found an N400 effect and a P600 effect for “The javelin has the athletes summarised” and a P600 effect for “The javelin has the athletes thrown”, relative to baseline. All examples transliterated from Dutch
Fig. 2
Fig. 2
Schematic architecture of the neurocomputational instantiation of Retrieval-Integration theory, implementing word-by-word language processing and the linkage of retrieval to the N400 and integration to the P600. For full detail on model implementation see Brouwer et al. (2021)
Fig. 3
Fig. 3
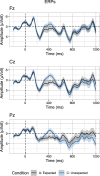
Grand-average ERPs on three midline electrodes (Fz, Cz, Pz) for two conditions of Aurnhammer et al. (2021) that manipulated target word expectancy. Waveforms were averaged per-condition from the per-subject per-condition averages. Error ribbons indicate confidence intervals based on standard errors computed across subjects
Fig. 4
Fig. 4
EEG signals binned by N400 averages (300–500 ms) in the Expected and Unexpected conditions of Aurnhammer et al. (2021) on electrode Pz. Error ribbons indicate confidence intervals based on standard errors computed across quantiles
Fig. 5
Fig. 5
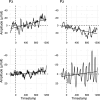
Four randomly selected single-trial waveforms from the Expected and Unexpected conditions in Aurnhammer et al. (2021). Regression lines indicate voltage trends over time
Fig. 6
Fig. 6
EEG signals grouped by bins obtained by subtracting average Segment voltage (0–1200 ms) from average N400 voltage (300–500 ms) in the Expected and Unexpected conditions of Aurnhammer et al. (2021). Error ribbons indicate confidence intervals based on standard errors computed across quantiles
Fig. 7
Fig. 7
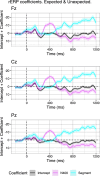
Model coefficients (added to their intercept) across time on three midline electrodes (Fz, Cz, Pz) for regression models fitted on two conditions of Aurnhammer et al. (2021). Coefficients express the extent to which single trial N400 amplitude (averaged from 300 to 500 ms) and Segment amplitude (averaged from 0 to 1200 ms) explain the EEG signal across time. Error ribbons indicate standard errors on the coefficients
Fig. 8
Fig. 8
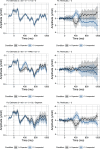
Forward estimates (left) and residual error (right) on three midline electrodes (Fz, Cz, Pz) from a set of regression models fitted using Eq. 1. Estimates and residuals were split per condition. Error ribbons indicate confidence intervals based on standard errors computed across subjects
Fig. 9
Fig. 9
Isolated forward estimates (left) and residual error (right) computed from rERP models fitted with all predictors present (Eq. 1). Estimates and residuals were split per condition. Rows contain the isolated estimates and residuals of the intercept (row 1), the intercept plus the N400 predictor (row 2), and the intercept plus the Segment predictor (row 3). Error ribbons indicate confidence intervals based on standard errors computed across subjects
Fig. 10
Fig. 10
Model coefficients (added to their intercept) across time on electrode Pz for regression models fitted separately on the Expected and Unexpected condition of Aurnhammer et al. (2021). Coefficients express the extent to which single trial N400 amplitude (averaged from 300 to 500 ms) and Segment amplitude (averaged from 0 to 1200 ms) explain the EEG signal across time. Error ribbons indicate standard errors on the coefficients
Fig. 11
Fig. 11
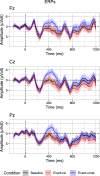
Average ERPs on three midline electrodes (Fz, Cz, Pz) in the baseline, event-related violation, and event-unrelated violation condition of Delogu et al. (2019). Error ribbons indicate confidence intervals based on standard errors computed across subjects
Fig. 12
Fig. 12
Model coefficients (added to their intercept) across time on electrode Pz for regression models fitted separately on the experimental conditions of Delogu et al. (2019). Coefficients express the extent to which single trial N400 amplitude (averaged from 300 to 500 ms) and Segment amplitude (averaged from 0 to 1200 ms) explain the EEG signal across time. Error ribbons indicate standard errors on the coefficients

Similar articles

Cited by

References

    1. Alday PM (2019) How much baseline correction do we need in ERP research? Extended GLM model can replace baseline correction while lifting its limits. Psychophysiology 56(12):e13451. 10.1111/psyp.13451 - PubMed
    1. Aurnhammer C, Delogu F, Brouwer H, Crocker MW (2023) The P600 as a continuous index of integration effort. Psychophysiology. 10.1111/psyp.14302 - PubMed
    1. Aurnhammer C, Delogu F, Schulz M, Brouwer H, Crocker MW (2021) Retrieval (N400) and integration (P600) in expectation-based comprehension. PLoS ONE 16(9):e0257430. 10.1371/journal.pone.0257430 - PMC - PubMed
    1. Bezanson J, Edelman A, Karpinski S, Shah VB (2017) Julia: A fresh approach to numerical computing. SIAM Rev 59(1):65–98. 10.1137/141000671
    1. Bornkessel-Schlesewsky I, Schlesewsky M (2008) An alternative perspective on “semantic P600’’ effects in language comprehension. Brain Res Rev 59(1):55–73. 10.1016/j.brainresrev.2008.05.003 - PubMed

LinkOut - more resources