

The evaluation of prothrombin time and activated partial thromboplastin time among diabetic and healthy controls in Africa: systematic review and meta-analysis
- PMID: 39712180
- PMCID: PMC11658991
- DOI: 10.3389/fmed.2024.1445031
The evaluation of prothrombin time and activated partial thromboplastin time among diabetic and healthy controls in Africa: systematic review and meta-analysis
Abstract
Introduction: Diabetes Mellitus (DM) is a disorder of multiple etiologies characterized by chronic hyperglycemia resulting from defects in insulin secretion and/or insulin action. DM patients have a disturbance of hemostasis, leading to a prothrombotic state characterized by platelet hypersensitivity, coagulation factor disorders, and hypo-fibrinolysis. Therefore, the primary goal of this systematic review and meta-analysis was to determine the pooled Standard Mean Difference (SMD) of prothrombin time (PT) and activated partial thromboplastin time (APTT) of DM patients in Africa.
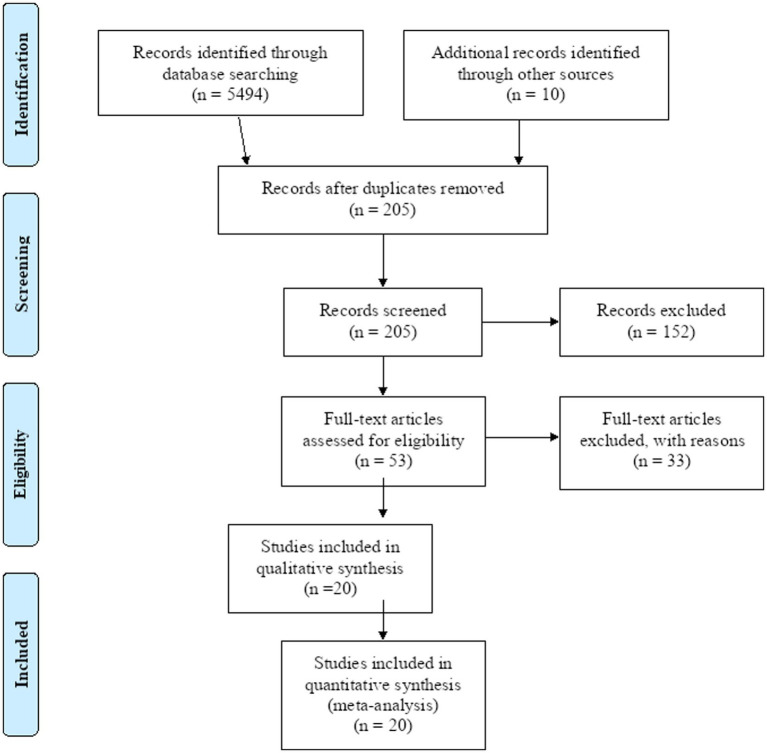
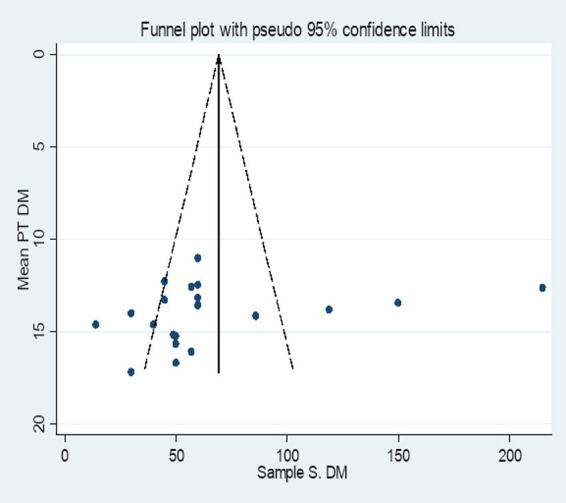
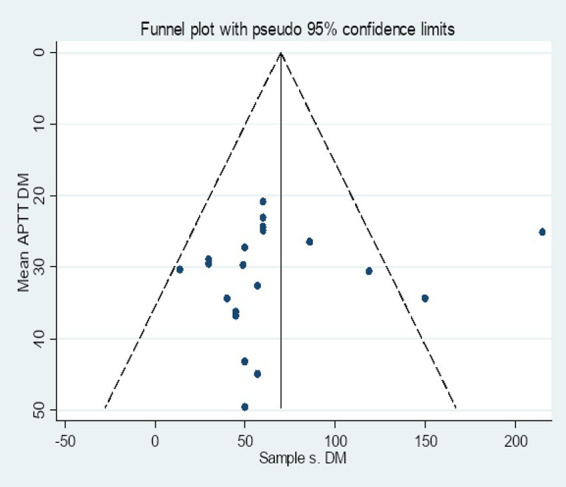
Methods: This systematic review and meta-analysis was conducted based on the guidelines of the PRISMA. PubMed, Google Scholar, Science Direct, Dove Press, Cochrane Online, and African journals online were searched systematically. The qualities of the included studies were assessed by two independent reviewers using the JBI critical appraisal tools. Data were extracted in an Excel sheet and then exported to STATA version 11 for analysis. A Random-effect model was fitted to estimate the pooled SMD and Higgins I-square test statistics were done to test the heterogeneity of studies. Funnel plots analysis and Egger-weighted regression tests were done to detect publication bias.
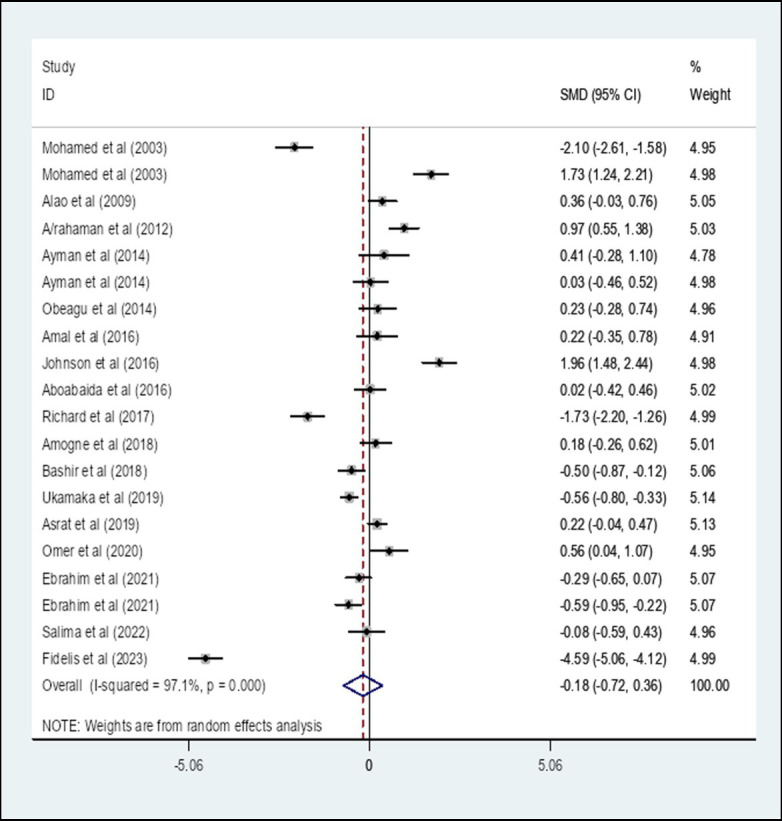
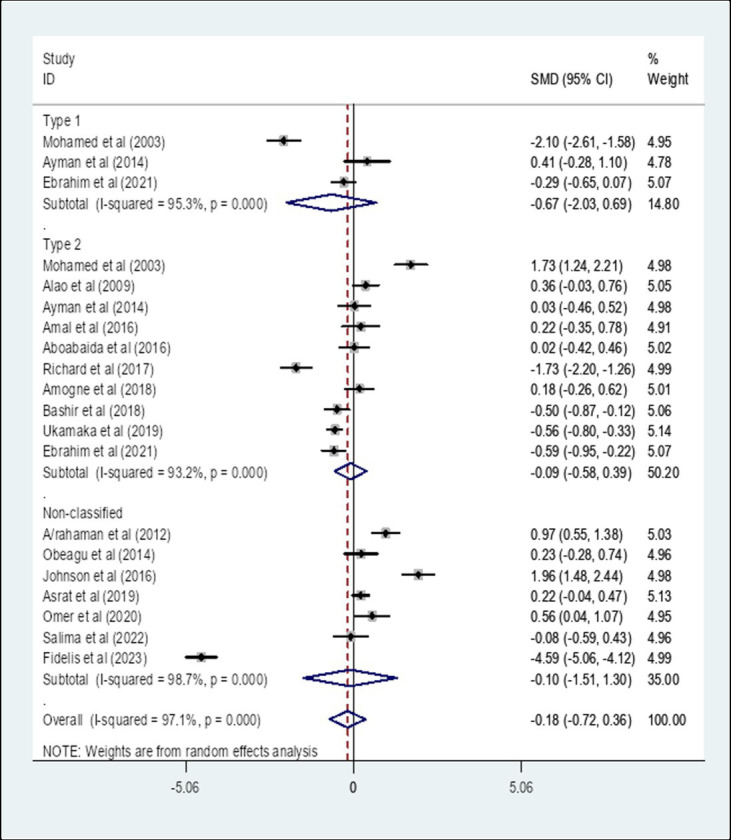
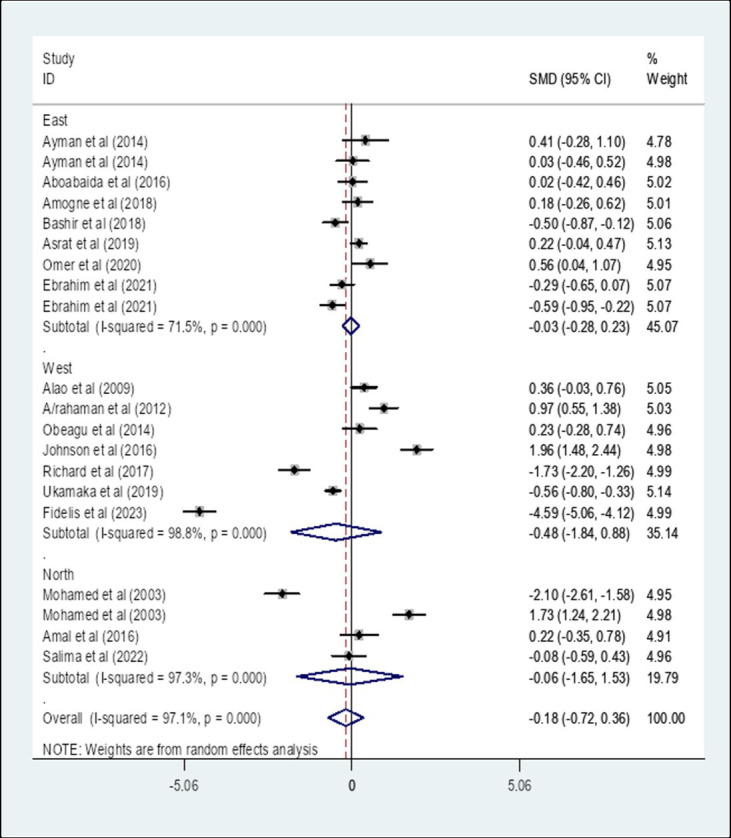
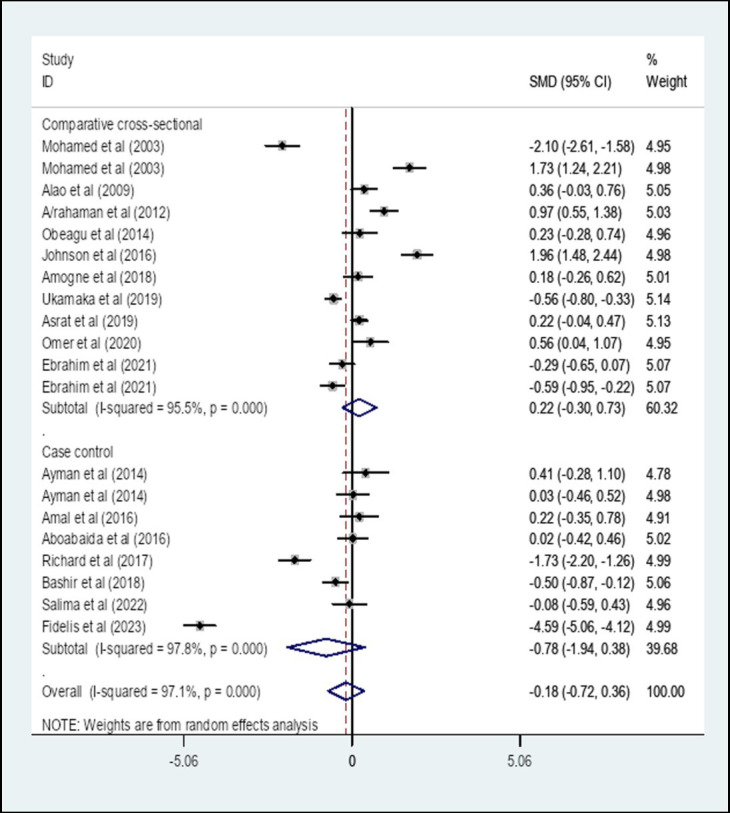
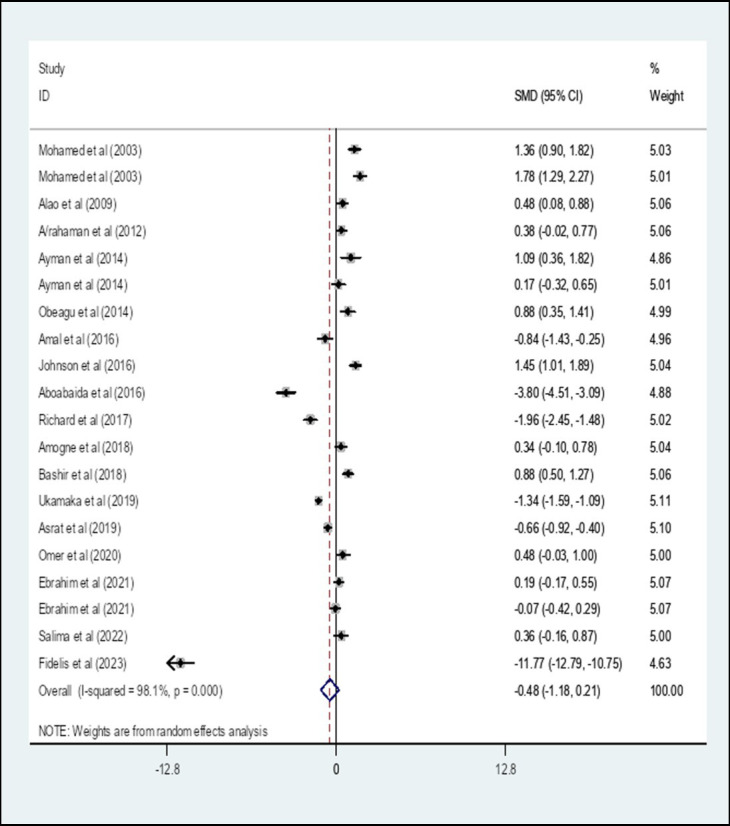
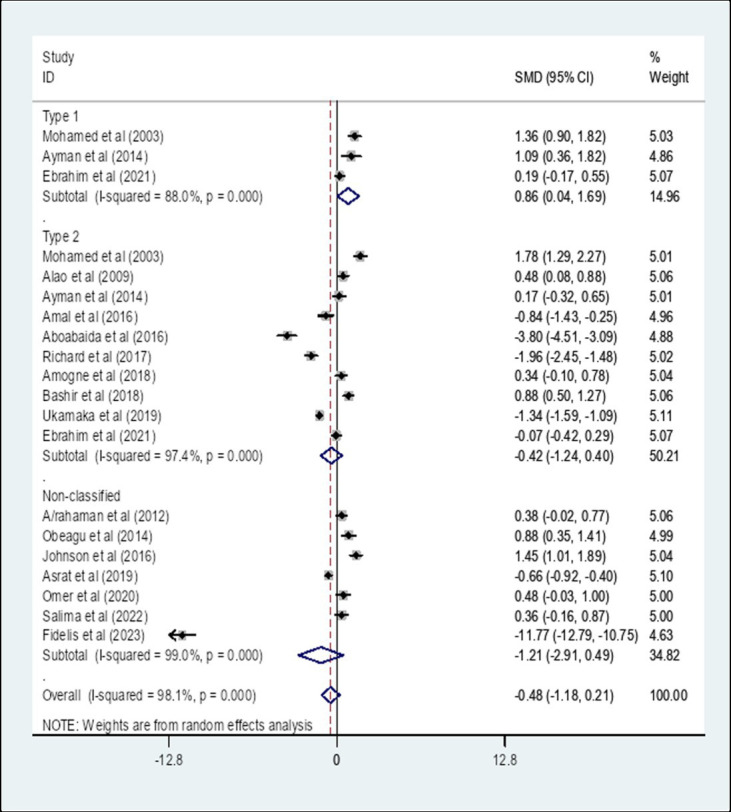
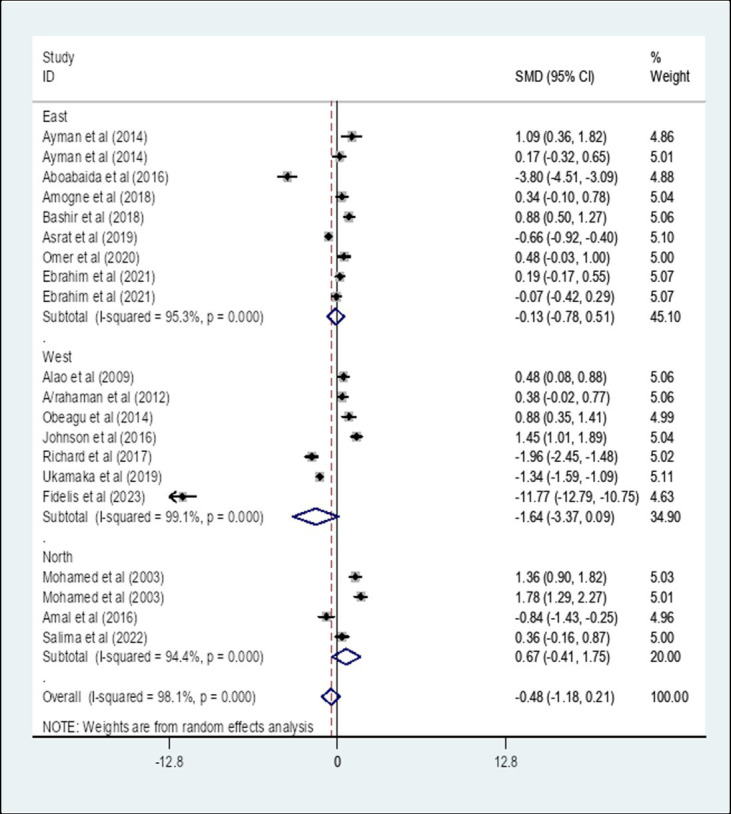
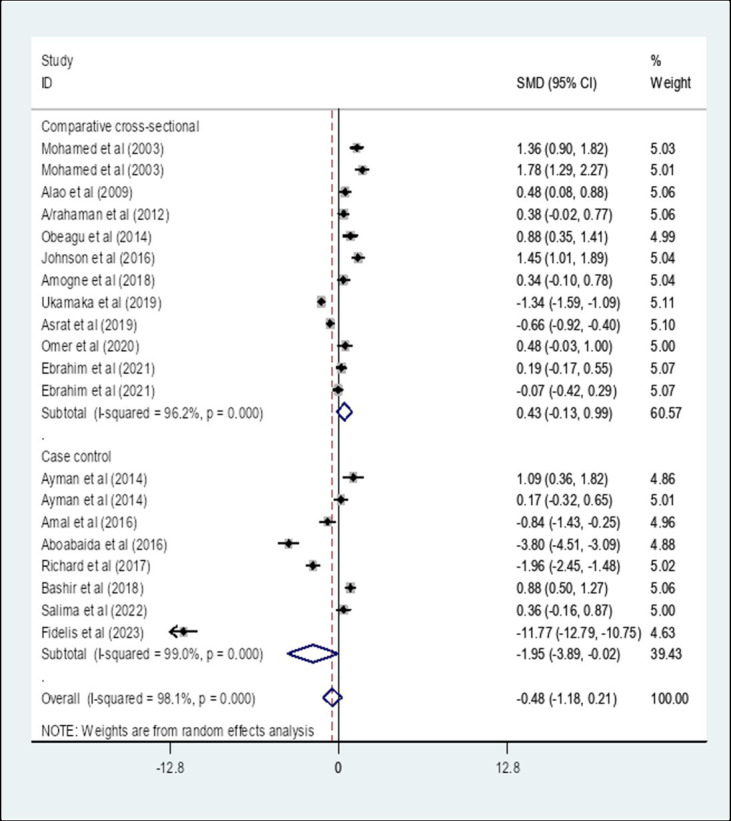
Results: The pooled SMD of PT among DM patients in Africa was -0.18, (95% CI: -0.72, 0.36). The pooled SMD of APTT among DM patients in Africa was -0.48, (95% CI: -1.18, 0.21). There was no statistically significant difference in the SMD of PT and APTT among DM patients in Africa compared to healthy controls. The pooled SMD of APTT among Type 1 DM patients in Africa was 0.86 (95% CI: 0.04, 1.69) whereas the SMD among Type 2 DM was -0.42 (95% CI: -1.24, 0.40). The SMD of APTT in Type 1 DM and controls showed a statistically significant difference compared with Type 2 DM and controls (p = 0.041). The SMD of APTT in Africa that is determined using a case-control study design showed a statistically significant difference compared to the SMD that is determined using a comparative cross-sectional study design.
Conclusion and recommendations: Even though different studies conducted across African countries showed the presence of coagulation abnormality in DM, this systematic review and meta-analysis revealed that there is no statistically significant SMD of PT and APTT in DM patients compared to healthy controls. However it is recommended that physicians routinely check APTT levels in Type I DM patients in order to evaluate coagulation status.
Keywords: Africa; activated partial thromboplastin time; diabetes mellitus; prothrombin time; systematic review and meta-analysis.
Copyright © 2024 Getu, Alemayehu, Tesfaye, Genanew and Walle.
Conflict of interest statement
The authors declare that the research was conducted in the absence of any commercial or financial relationships that could be construed as a potential conflict of interest.
Figures
Similar articles
-
Association of prothrombin time, thrombin time and activated partial thromboplastin time levels with preeclampsia: a systematic review and meta-analysis.BMC Pregnancy Childbirth. 2024 May 13;24(1):354. doi: 10.1186/s12884-024-06543-7. BMC Pregnancy Childbirth. 2024. PMID: 38741046 Free PMC article.
-
The prevalence of anemia among human immunodeficiency virus-infected individuals in East Africa: A systematic review and meta-analysis.Medicine (Baltimore). 2023 May 19;102(20):e33810. doi: 10.1097/MD.0000000000033810. Medicine (Baltimore). 2023. PMID: 37335739 Free PMC article.
-
Coagulation abnormalities in Dengue fever infection: A systematic review and meta-analysis.PLoS Negl Trop Dis. 2021 Aug 18;15(8):e0009666. doi: 10.1371/journal.pntd.0009666. eCollection 2021 Aug. PLoS Negl Trop Dis. 2021. PMID: 34407078 Free PMC article.
-
Coagulation Parameters in Human Immunodeficiency Virus Infected Patients: A Systematic Review and Meta-Analysis.AIDS Res Treat. 2022 Apr 21;2022:6782595. doi: 10.1155/2022/6782595. eCollection 2022. AIDS Res Treat. 2022. PMID: 35492260 Free PMC article. Review.
-
Prevalence of diabetic peripheral neuropathy in Africa: a systematic review and meta-analysis.BMC Endocr Disord. 2020 Apr 15;20(1):49. doi: 10.1186/s12902-020-0534-5. BMC Endocr Disord. 2020. PMID: 32293400 Free PMC article.
References
-
- Sun H, Saeedi P, Karuranga S, Pinkepank M, Ogurtsova K, Duncan BB, et al. . IDF diabetes Atlas: global, regional and country-level diabetes prevalence estimates for 2021 and projections for 2045. Diabetes Res Clin Pract. (2022) 183:109119. doi: 10.1016/j.diabres.2021.109119, PMID: - DOI - PMC - PubMed
-
- Atlas D. IDF diabetes atlas. 9th ed. Available at: http://www.idf.org/about-diabetes/facts-figures International Diabetes Federation; (2019).
-
- Atlas D. International diabetes federation. IDF Diabetes Atlas. 7th ed. International Diabetes Federation: Belgium; (2015).
Publication types
LinkOut - more resources
Full Text Sources