. 2024 Dec 5:15:1509049.
doi: 10.3389/fgene.2024.1509049. eCollection 2024.

Exploring the impact of deubiquitination on melanoma prognosis through single-cell RNA sequencing

Affiliations

Exploring the impact of deubiquitination on melanoma prognosis through single-cell RNA sequencing

Su Peng et al. Front Genet. .

Abstract

Background: Cutaneous melanoma, characterized by the malignant proliferation of melanocytes, exhibits high invasiveness and metastatic potential. Thus, identifying novel prognostic biomarkers and therapeutic targets is essential.

Methods: We utilized single-cell RNA sequencing data (GSE215120) from the Gene Expression Omnibus (GEO) database, preprocessing it with the Seurat package. Dimensionality reduction and clustering were executed through Principal Component Analysis (PCA) and Uniform Manifold Approximation and Projection (UMAP). Cell types were annotated based on known marker genes, and the AUCell algorithm assessed the enrichment of deubiquitination-related genes. Cells were categorized into DUB_high and DUB_low groups based on AUCell scores, followed by differential expression analysis. Importantly, we constructed a robust prognostic model utilizing various genes, which was evaluated in the TCGA cohort and an external validation cohort.

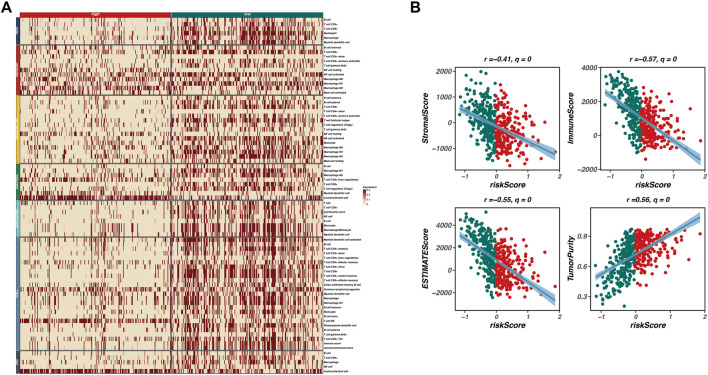
Results: Our prognostic model, developed using Random Survival Forest (RSF) and Ridge Regression methods, demonstrated excellent predictive performance, evidenced by high C-index and AUC values across multiple cohorts. Furthermore, analyses of immune cell infiltration and tumor microenvironment scores revealed significant differences in immune cell distribution and microenvironment characteristics between high-risk and low-risk groups. Functional experiments indicated that TBC1D16 significantly impacts the migration and proliferation of melanoma cells.

Conclusion: This study highlights the critical role of deubiquitination in melanoma and presents a novel prognostic model that effectively stratifies patient risk. The model's strong predictive ability enhances clinical decision-making and provides a framework for future studies on the therapeutic potential of deubiquitination mechanisms in melanoma progression. Further validation and exploration of this model's applicability in clinical settings are warranted.

Keywords: deubiquitination; immune microenvironment; melanoma; prognostic model; single-cell RNA sequencing.


Conflict of interest statement

The authors declare that the research was conducted in the absence of any commercial or financial relationships that could be construed as a potential conflict of interest.

Figures

FIGURE 1
FIGURE 1
Single-Cell RNA Sequencing Analysis of Cutaneous Melanoma Microenvironment Single-cell RNA sequencing was conducted on cutaneous melanoma samples (GSM6622299, GSM6622300, and GSM6622301) to investigate the microenvironmental landscape. (A, B) The UMAP plot displays the clustering of 27,163 individual cells into distinct populations, identified through Seurat clustering methods and annotated for cell types. These populations comprise endothelial cells, NKT cells, epithelial cells, B cells, cycling cells, fibroblasts, and myeloid cells. (C) The proportional distribution of these cell types across the three samples highlights variability in cellular composition. (D) The expression patterns of selected marker genes across various cell types are shown, with dot size indicating the percentage of expressing cells and color intensity representing average expression levels. This confirms the successful identification of diverse cell populations. (E) AUCell scoring identifies cells exhibiting high activity of deubiquitination (DUB)-related genes, color-coded by DUB activity scores, with notable activity in cycling and epithelial cell populations. (F) The average expression levels and prevalence of DUB-related gene expression across cell types emphasize significant expression in cycling and epithelial cells. (G, H) Cell-cell communication analysis, conducted using the CellChat tool, compares interaction networks between DUBlow and DUBhigh groups. The DUB_high cells, particularly in endothelial and fibroblast populations, demonstrate more extensive and stronger intercellular communication activity. (I, J) Specific quantitative analysis of intercellular communication. (K) Acquisition of the top 150 relevant genes.
FIGURE 2
FIGURE 2
Identification of the optimal prognostic model. This figure illustrates the process of identifying a set of prognostic genes through an integrated machine learning approach. Differentially expressed genes were combined with the 150 key genes derived from single-cell sequencing data. Univariate Cox regression analysis applied to the TCGA cohort revealed several genes with significant prognostic value. Among 101 tested combinations, the Random Survival Forest (RSF) combined with Ridge regression was identified as the optimal model, achieving the highest concordance index (c-index) in the validation cohort. This model is designated as the DUB-related signature (DRS), indicating its potential as a robust prognostic tool for cutaneous melanoma.
FIGURE 3
FIGURE 3
Survival analysis and model validation in multiple cohorts. Survival analysis across multiple datasets, including TCGA, GSE19234, GSE22153, GSE59455, and GSE65904, is shown in this figure. (A–E) Survival curves demonstrate significant differences in survival probabilities between high-risk and low-risk groups, with p-values consistently below 0.05, confirming the robustness of the model. (F–J) Receiver Operating Characteristic (ROC) curves illustrate the Area Under the Curve (AUC) values at various time points, reflecting the model’s accuracy in distinguishing between high- and low-risk patients. AUC values range from 0.52 to 0.85, with the TCGA cohort achieving an AUC of 0.75 at 5 years. (K–O) Principal Component Analysis (PCA) effectively segregates high-risk and low-risk patient groups based on the first two principal components. Density plots highlight the distribution of risk scores within the identified clusters, reinforcing the prognostic model’s effectiveness in predicting survival outcomes and capturing biological heterogeneity within melanoma samples.
FIGURE 4
FIGURE 4
Immune infiltration and tumor microenvironment analysis. This figure investigates the relationship between the prognostic model and the tumor microenvironment (TME) through immune infiltration analysis. (A) A heatmap displays the expression levels of various immune cell types across high-risk and low-risk groups, revealing a distinct immune landscape with significant differences. High-risk patients exhibit a lower abundance of immune cell types, including CD4+ T cells, regulatory T cells, and macrophages, indicating an immunosuppressive TME. (B) Correlation analyses between risk scores and various TME characteristics are presented as scatter plots, showing significant negative correlations between risk scores and both immune scores (r = −0.57, q = 0) and stromal scores (r = −0.41, q = 0), along with a positive correlation between risk scores and tumor purity (r = 0.56, q = 0). These findings suggest that higher risk scores are associated with lower immune infiltration and stromal content, reflecting a more tumor-promoting microenvironment.
FIGURE 5
FIGURE 5
Composition of the prognostic model. This figure illustrates the composition of the prognostic model, consisting of 22 genes. Among these genes, TBC1D16 shows the strongest positive correlation with the model’s risk score, indicating its significant association with poor prognosis in patients with cutaneous melanoma. The construction of this model highlights the importance of these genes in predicting patient outcomes in melanoma.
FIGURE 6
FIGURE 6
Validation of key gene TBC1D16 in skin melanoma. This figure presents the validation results for the key gene TBC1D16. Cox regression analysis revealed that TBC1D16 is significantly associated with unfavorable prognosis across multiple cohorts (A). Kaplan-Meier survival curves demonstrate that high expression levels of TBC1D16 correlate with worse patient outcomes in the TCGA, GSE19234, and GSE190113 datasets (B–D). Gene Set Enrichment Analysis (GSEA) further indicates that TBC1D16 is highly correlated with several cancer-related pathways, including oxidative phosphorylation and Myc target pathways (E). Gene Ontology (GO) and Kyoto Encyclopedia of Genes and Genomes (KEGG) enrichment analyses reveal that TBC1D16 is associated with various cancer functions and pathways (F, G). Finally, we validated the functional role of TBC1D16 in the A375 cell line, showing that knockdown of TBC1D16 resulted in a significant decrease in both proliferation and migration capabilities of skin melanoma cells (H, I).

Similar articles

References

    1. Arnold M., Singh D., Laversanne M., Vignat J., Vaccarella S., Meheus F., et al. (2022). Global burden of cutaneous melanoma in 2020 and projections to 2040. JAMA Dermatol 158 (5), 495–503. 10.1001/jamadermatol.2022.0160 - DOI - PMC - PubMed
    1. Bertolotto C. (2021). Cutaneous and uveal melanoma: two different cancers in therapeutic needs. C R. Biol. 344 (3), 219–231. 10.5802/crbiol.63 - DOI - PubMed
    1. Bogunovic D., O'Neill D. W., Belitskaya-Levy I., Vacic V., Yu Y. L., Adams S., et al. (2009). Immune profile and mitotic index of metastatic melanoma lesions enhance clinical staging in predicting patient survival. Proc. Natl. Acad. Sci. U. S. A. 106 (48), 20429–20434. 10.1073/pnas.0905139106 - DOI - PMC - PubMed
    1. Budden T., Davey R. J., Vilain R. E., Ashton K. A., Braye S. G., Beveridge N. J., et al. (2016). Repair of UVB-induced DNA damage is reduced in melanoma due to low XPC and global genome repair. Oncotarget 7 (38), 60940–60953. 10.18632/oncotarget.10902 - DOI - PMC - PubMed
    1. Buja A., Rugge M., Damiani G., Zorzi M., De Toni C., Vecchiato A., et al. (2022). Sex differences in cutaneous melanoma: incidence, clinicopathological profile, survival, and costs. J. Womens Health (Larchmt) 31 (7), 1012–1019. 10.1089/jwh.2021.0223 - DOI - PMC - PubMed

LinkOut - more resources