

Engineered feature embeddings meet deep learning: A novel strategy to improve bone marrow cell classification and model transparency
- PMID: 39712979
- PMCID: PMC11662281
- DOI: 10.1016/j.jpi.2024.100390
Engineered feature embeddings meet deep learning: A novel strategy to improve bone marrow cell classification and model transparency
Abstract
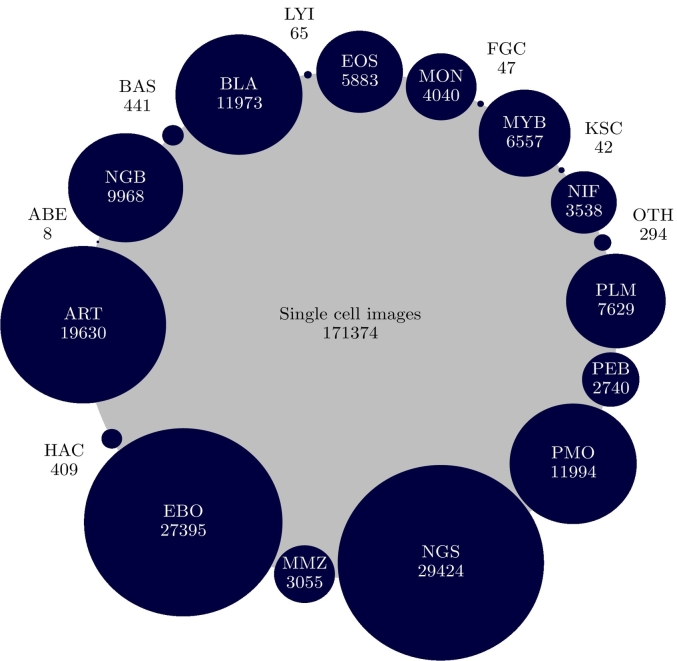
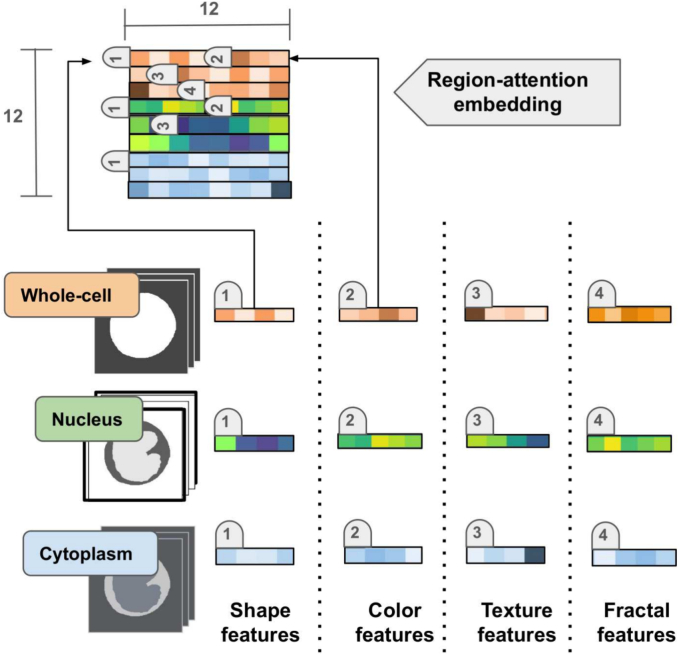
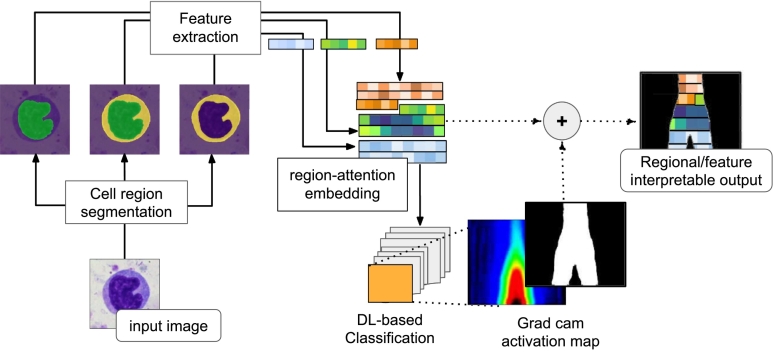
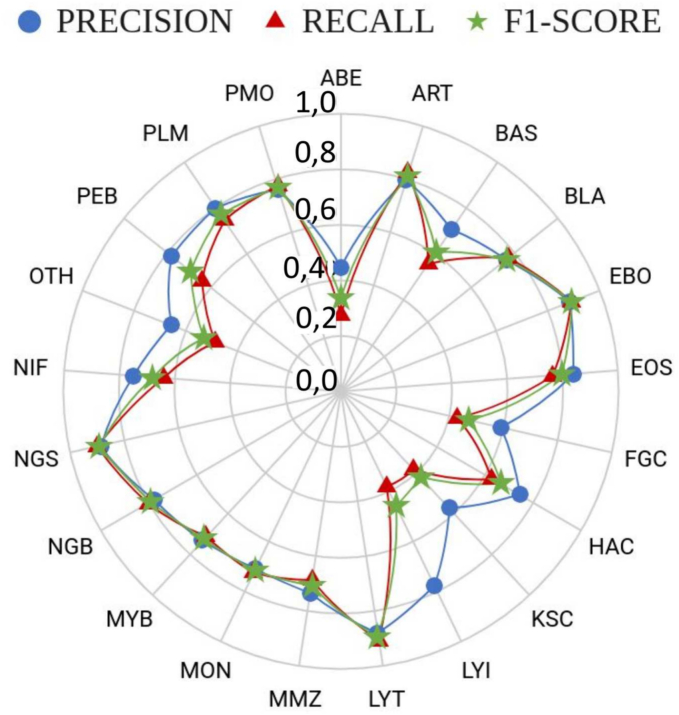
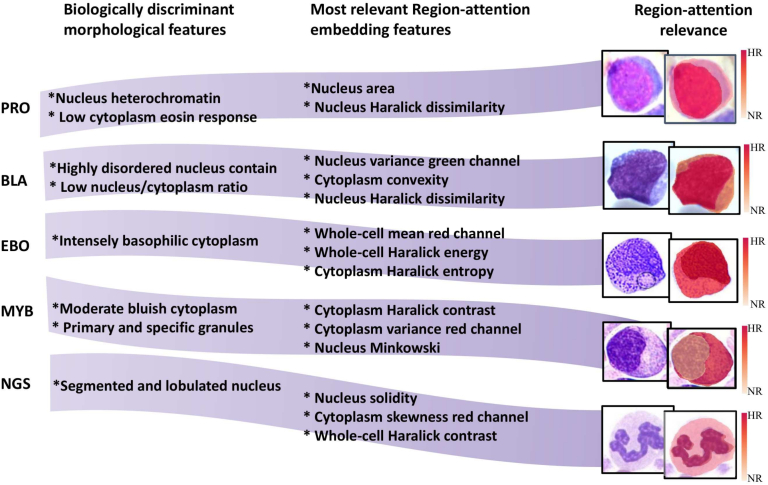
Cytomorphology evaluation of bone marrow cell is the initial step to diagnose different hematological diseases. This assessment is still manually performed by trained specialists, who may be a bottleneck within the clinical process. Deep learning algorithms are a promising approach to automate this bone marrow cell evaluation. These artificial intelligence models have focused on limited cell subtypes, mainly associated to a particular disease, and are frequently presented as black boxes. The herein introduced strategy presents an engineered feature representation, the region-attention embedding, which improves the deep learning classification performance of a cytomorphology with 21 bone marrow cell subtypes. This embedding is built upon a specific organization of cytology features within a squared matrix by distributing them after pre-segmented cell regions, i.e., cytoplasm, nucleus, and whole-cell. This novel cell image representation, aimed to preserve spatial/regional relations, is used as input of the network. Combination of region-attention embedding and deep learning networks (Xception and ResNet50) provides local relevance associated to image regions, adding up interpretable information to the prediction. Additionally, this approach is evaluated in a public database with the largest number of cell subtypes (21) by a thorough evaluation scheme with three iterations of a 3-fold cross-validation, performed in 80% of the images (n = 89,484), and a testing process in an unseen set of images composed by the remaining 20% of the images (n = 22,371). This evaluation process demonstrates the introduced strategy outperforms previously published approaches in an equivalent validation set, with a f1-score of 0.82, and presented competitive results on the unseen data partition with a f1-score of 0.56.
Keywords: Biomedical image processing; Bone marrow cell subtypes; Cytomorphology; Deep learning; Interpretability.
© 2024 The Authors.
Conflict of interest statement
The authors declare the following financial interests/personal relationships which may be considered as potential competing interests: Eduardo Romero reports financial support was provided by Colombia Ministry of Science Technology and Innovation. Jonathan Tarquino reports a relationship with Colombia Ministry of Science Technology and Innovation that includes: funding grants. If there are other authors, they declare that they have no known competing financial interests or personal relationships that could have appeared to influence the work reported in this article.
Figures
References
-
- Thachil J., Bates I. twelfth ed ed. Elsevier Ltd.; 2017. Approach to the Diagnosis and Classification of Blood Cell Disorders. - DOI
-
- Ladines-Castro W., Barragán-Ibañez G., Luna-Pérez M., et al. Morphology of leukaemias. Revista Médica del Hospital General de México. 2016;79(2):107–113. doi: 10.1016/j.hgmx.2015.06.007. - DOI
-
- Wu Q., Zeng L., Ke H., Xie W., Zheng H., Zhang Y. Medical Imaging 2005: Image Processing. Vol. 5747. SPIE; 2005. Analysis of blood and bone marrow smears using multispectral imaging analysis techniques; pp. 1872–1882.
-
- Tomasian A., Jennings J.W. Bone marrow aspiration and biopsy: techniques and practice implications. Skeletal Radiol. 2022;51(1):81–88. - PubMed
-
- Malempati S., Joshi S., Lai S., Braner D.A., Tegtmeyer K. Bone marrow aspiration and biopsy. N Engl J Med. 2009;361(15):28. - PubMed
LinkOut - more resources
Full Text Sources
