. 2024 Nov 8;4(6):737-750.
doi: 10.1021/acsmeasuresciau.4c00063. eCollection 2024 Dec 18.

Design and Optimization of Isothermal Gene Amplification for Generation of High-Gain Oligonucleotide Products by MicroRNAs

Affiliations

Design and Optimization of Isothermal Gene Amplification for Generation of High-Gain Oligonucleotide Products by MicroRNAs

Jihee Lee et al. ACS Meas Sci Au. .

Abstract

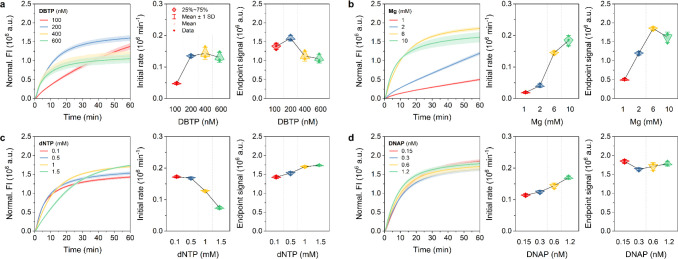
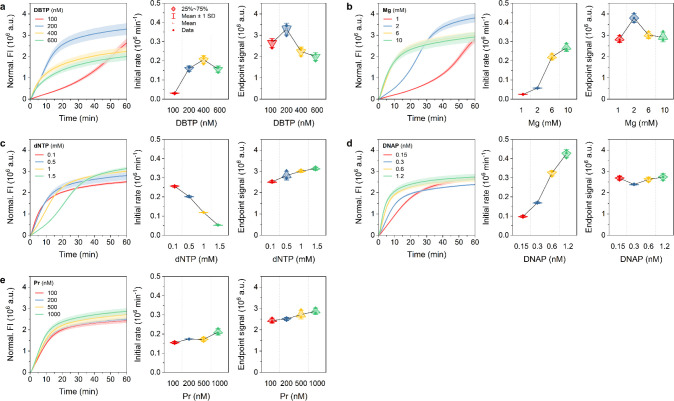
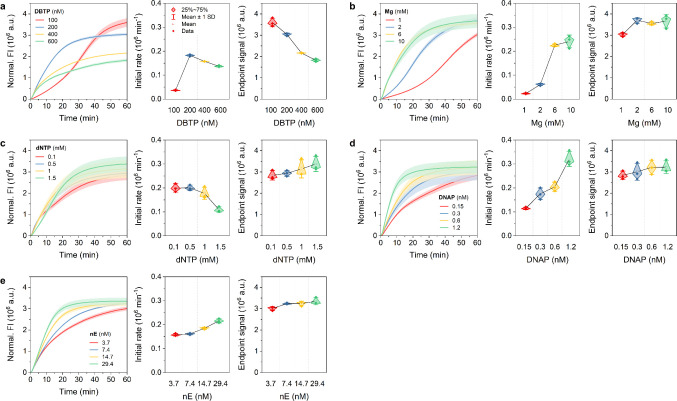
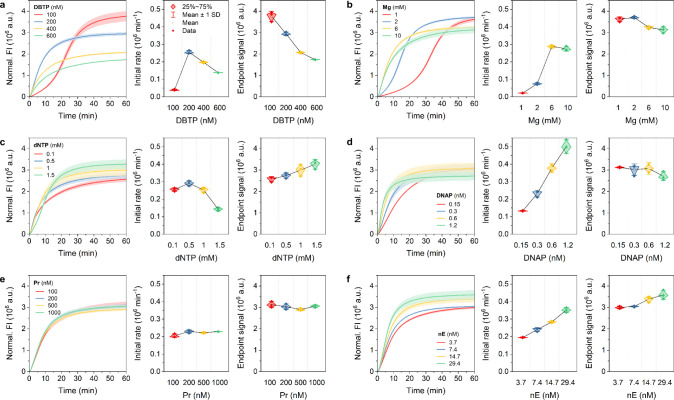
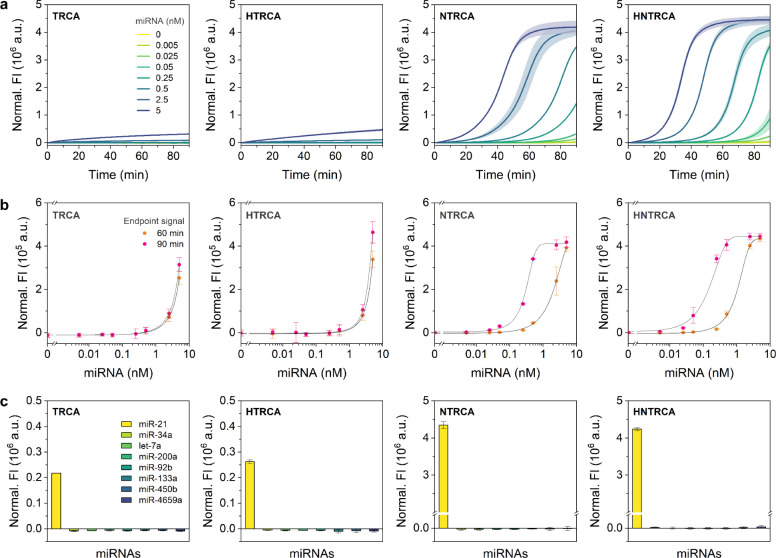
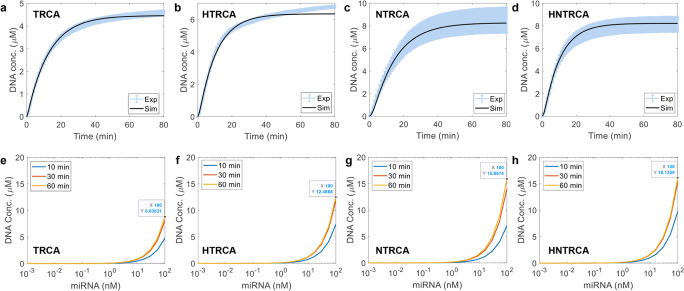
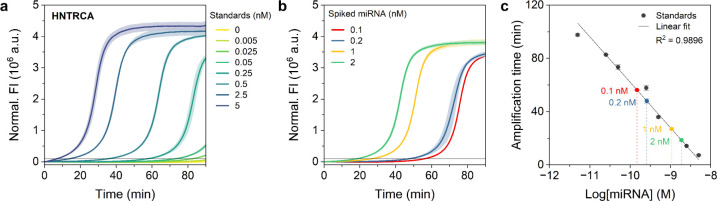
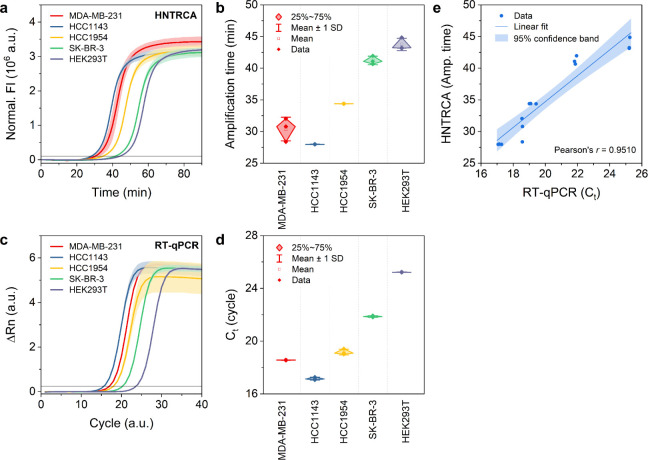
Thermal cycling-based quantitative polymerase chain reaction (qPCR) represents the gold standard method for accurate and sensitive nucleic acid quantification in laboratory settings. However, its reliance on costly thermal cyclers limits the implementation of this technique for rapid point-of-care (POC) diagnostics. To address this, isothermal amplification techniques such as rolling circle amplification (RCA) have been developed, offering a simpler alternative that can operate without the need for sophisticated instrumentation. This study focuses on the development and optimization of toehold-mediated RCA (TRCA), which employs a conformationally switchable dumbbell DNA template for the sensitive and selective detection of cancer-associated miRNAs, specifically miR-21. In addition, we developed variants of hyperbranched TRCA (HTRCA), nicking-assisted TRCA (NTRCA), and hyperbranched NTRCA (HNTRCA) to facilitate exponential amplification by enhancing TRCA through the sequential incorporation of reverse primer (Pr) and nicking endonuclease (nE). By conducting a systematic kinetic analysis of the initial rate and end point signals for varying concentrations of key reaction components, we could identify optimal conditions that markedly enhanced the sensitivity and specificity of the TRCA variants. In particular, HNTRCA, which exploits the synergistic effect of Pr and nE, demonstrated an approximately 3000-fold improvement in the detection limit (260 fM) and a wider dynamic range of more than 4 log orders of magnitude compared to TRCA, thereby evidencing its superior performance. Also, we established a mechanistic model for TRCA that includes the roles of Pr and nE in different amplification processes. Model parameters were fitted to the experimental data, and additional simulations were conducted to compare the four amplification methods. Further tests with real biological samples revealed that this technique showed a good correlation with qPCR in quantifying miR-21 expression in various cell lines (0.9510 of Pearson's r), confirming its potential as a robust and rapid tool for nucleic acid detection. Therefore, the simplicity, high sensitivity, and potential for integration with POC diagnostic platforms make the HNTRCA system suitable for field deployment in resource-limited environments.


Conflict of interest statement

The authors declare no competing financial interest.

Figures

Scheme 1
Scheme 1. Schematic Illustration of the Conventional TRCA and Modified TRCAs (HTRCA, NTRCA, and HNTRCA) Reaction Pathways Initiated by Toehold-Mediated Displacement and Subsequent Circularization of DBTP in the Presence of a Target miRNA
DBTP, dumbbell DNA template; DNAP, DNA polymerase; DNAP–Mg, Mg-bound DNAP; miRNA, microRNA; dNTP, deoxynucleoside triphosphates; dNTP–Mg, Mg-bound dNTP; Pr, reverse primer; nE, nicking endonuclease; Mg, magnesium ion
Figure 1
Figure 1
Kinetics of TRCA under four different conditions. Real-time fluorescence curves (left), initial rates (middle), and end point signals (right) of TRCA performed in the presence of a target miRNA (50 nM) at 50 °C for 1 h with various concentrations of a) DBTP, b) Mg, c) dNTP, and d) DNAP, respectively. The initial rate and end point signal represent the rate of increase in normalized fluorescence intensity (FI) within the initial phase of the reaction and the normalized FI after 1-h reaction. Data represent mean ± s.d. for three independent experiments.
Figure 2
Figure 2
Kinetics of HTRCA under five different conditions. Real-time fluorescence curves (left), initial rates (middle), and end point signals (right) of HTRCA performed in the presence of a target miRNA (50 nM) at 50 °C for 1 h with various concentrations of a) DBTP, b) Mg, c) dNTP, d) DNAP, and e) Pr, respectively. Data represent mean ± s.d. for three independent experiments.
Figure 3
Figure 3
Kinetics of NTRCA under five different conditions. Real-time fluorescence curves (left), initial rates (middle), and end point signals (right) of NTRCA performed in the presence of a target miRNA (50 nM) at 50 °C for 1 h with various concentrations of a) DBTP, b) Mg, c) dNTP, d) DNAP, and e) nE, respectively. Data represent mean ± s.d. for three independent experiments.
Figure 4
Figure 4
Kinetics of HNTRCA under six different conditions. Real-time fluorescence curves (left), initial rates (middle), and end point signals (right) of HNTRCA performed in the presence of a target miRNA (50 nM) at 50 °C for 1 h with various concentrations of a) DBTP, b) Mg, c) dNTP, d) DNAP, e) Pr, and f) nE, respectively. Data represent mean ± s.d. for three independent experiments.
Figure 5
Figure 5
Comparison of analytical sensitivity and specificity of TRCAs. a) Real-time fluorescence curves, b) target dose–response curves, and c) target specificity results of TRCA, HTRCA, NTRCA, and HNTRCA. For sensitivity tests, each reaction was performed with various concentrations of target miRNA, ranging from 0 to 5 nM, at 50 °C for 90 min. The end point signals after 60- and 90-min reactions were used to construct dose–response curves. For specificity tests, each reaction was conducted with eight different miRNAs (5 nM) at 50 °C for 1 h. All reactions were carried out under the optimized conditions, including 200 nM DBTP, 6 mM Mg, 1.5 mM dNTP, 1.5 mM DNAP, 200 nM Pr, and 14.7 nM nE. Data represent mean ± s.d. for three independent experiments.
Figure 6
Figure 6
Comparison of experimental data with calculation results. a–d) Measured and simulated results of total DNA concentration changes with time. e–h) Simulation results of total DNA concentration changes with respect to varying miRNA concentrations at 10, 30, and 60 min of amplification. Simulations were performed with the data-fitted model parameters for representative conditions, including 200 nM DBTP, 6 mM Mg, 1 mM dNTP, 0.3 mM DNAP, 500 nM Pr, and 7.35 nM nE.
Figure 7
Figure 7
Quantification of synthetic miR-21 in total RNA extracts using HNTRCA. Real-time fluorescence curves of the HNTRCA with a) serial dilutions of synthetic miR-21 standards (0–5 nM) and b) miR-21 at four different concentrations (0.1, 0.2, 1, and 2 nM) spiked into 100 ng total RNA extracted from HEK 293T cells. The HNTRCA reaction was conducted at 50 °C for 90 min under the optimized conditions. The black solid line of the curves in a) and b) indicates the threshold (105) to determine the amplification time. c) Linear standard curve with serial dilutions of synthetic miR-21 standards to quantify the concentration of spiked miRNA in total RNA extracts. Data represent mean ± s.d. for two or three independent experiments.
Figure 8
Figure 8
Determination of the presence of miR-21 in total RNA extracted from various cell lines using HNTRCA and RT-qPCR. a) Real-time fluorescence curves and b) amplification time of the HNTRCA reaction with 100 ng total RNA extracted from five different cell lines. The HNTRCA reaction was conducted at 50 °C for 90 min under the optimized conditions. c) Real-time amplification curves and d) cycles to threshold (Ct) of the RT-qPCR assay with 0.5 ng input cDNA prepared from five different cell lines. e) Correlation between the measurements by HNTRCA and RT-qPCR for miR-21 quantification. The black solid line of the curves in a) and c) indicates the threshold to determine the amplification time and Ct value, respectively. Data represent mean ± s.d. for two or three independent experiments.

Similar articles

References

    1. Heid C. A.; Stevens J.; Livak K. J.; Williams P. M. Real Time Quantitative PCR. Genome Res. 1996, 6 (10), 986–994. 10.1101/gr.6.10.986. - DOI - PubMed
    1. Nayak S.; Blumenfeld N. R.; Laksanasopin T.; Sia S. K. Point-of-Care Diagnostics: Recent Developments in a Connected Age. Anal. Chem. 2017, 89 (1), 102–123. 10.1021/acs.analchem.6b04630. - DOI - PMC - PubMed
    1. Petralia S.; Conoci S. PCR Technologies for Point of Care Testing: Progress and Perspectives. ACS Sens. 2017, 2 (7), 876–891. 10.1021/acssensors.7b00299. - DOI - PubMed
    1. Craw P.; Balachandran W. Isothermal Nucleic Acid Amplification Technologies for Point-of-Care Diagnostics: A Critical Review. Lab Chip 2012, 12 (14), 2469–2486. 10.1039/c2lc40100b. - DOI - PubMed
    1. Zhao Y.; Chen F.; Li Q.; Wang L.; Fan C. Isothermal Amplification of Nucleic Acids. Chem. Rev. 2015, 115 (22), 12491–12545. 10.1021/acs.chemrev.5b00428. - DOI - PubMed

LinkOut - more resources