

Body mass index and waist-to-height ratio effect on mortality in non-alcoholic fatty liver: revisiting the obesity paradox
- PMID: 39713050
- PMCID: PMC11658989
- DOI: 10.3389/fendo.2024.1419715
Body mass index and waist-to-height ratio effect on mortality in non-alcoholic fatty liver: revisiting the obesity paradox
Abstract
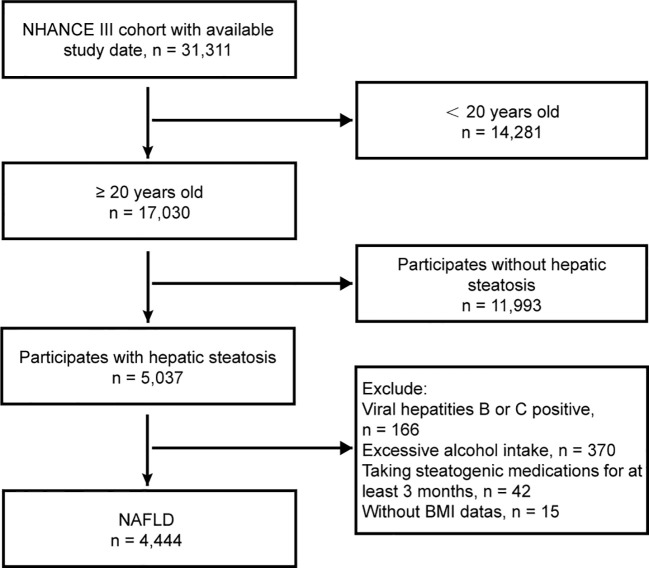
Purpose: Emerging research indicates that individuals with non-alcoholic fatty liver disease (NAFLD) who carry excess weight have similar or even higher survival rates than their normal-weight counterparts. This puzzling "obesity paradox" may be attributed to underlying biases. To explore this phenomenon, we examined data extracted from the third National Health and Nutrition Examination Survey (NHANES) III, which spanned from 1988-1994.
Methods: We specifically targeted participants diagnosed with NAFLD through ultrasound due to fatty liver presence and employed multivariate Cox regression to assess mortality risk associated with body mass index (BMI) and the waist-to-height ratio (WHtR).
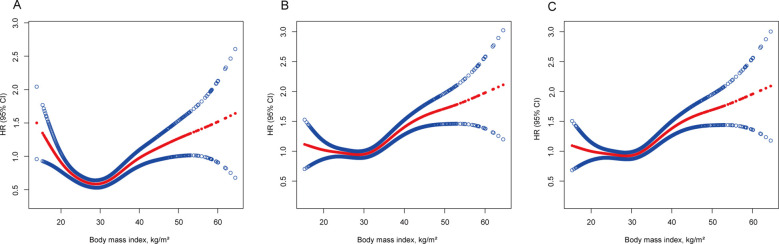
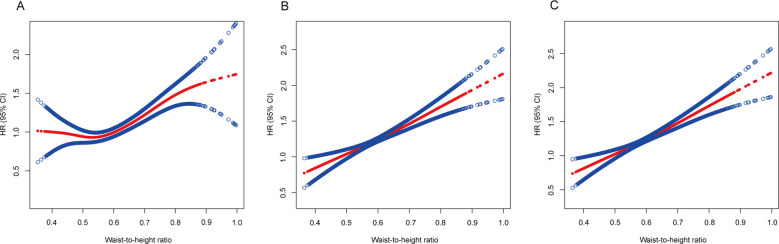
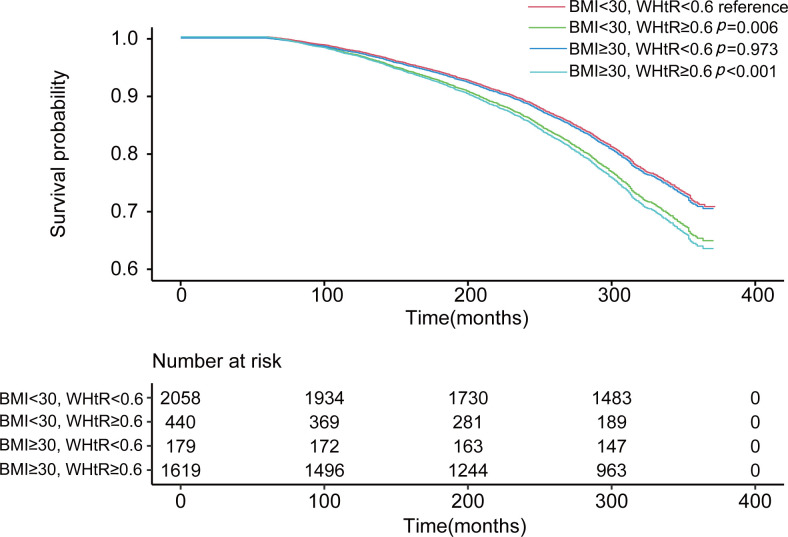
Results: Over a median follow-up period of 20.3 [19.9-20.7] years, 1832 participants passed away. The study revealed an intriguing "obesity-survival paradox", in which individuals classified as overweight (HR 0.926, 95% CI 0.925-0.927) or obese (HR 0.982, 95% CI 0.981-0.984) presented reduced mortality risks compared with those categorized as normal weight. However, this paradox vanished upon adjustments for smoking and exclusion of the initial 5-year follow-up period (HR 1.046, 95% CI 1.044-1.047 for overweight; HR 1.122, 95% CI 1.120-1.124 for obesity class I). Notably, the paradox was less pronounced with the WHtR, which was significantly different only in quartile 2 (HR 0.907, 95% CI 0.906-0.909) than in quartile 1, and was resolved after appropriate adjustments. In particular, when BMI and WHtR were considered together, higher levels of adiposity indicated a greater risk of mortality with WHtR, whereas BMI did not demonstrate the same trend (p <0.05).
Conclusion: The "obesity paradox" in NAFLD patients can be explained by smoking and reverse causation. WHtR was a better predictor of mortality than BMI.
Keywords: anthropometrics; body mass index; mortality; overweight; waist-to-height ratio.
Copyright © 2024 Jiang, Li, Yu, Huang, Yang, Wu and Yang.
Conflict of interest statement
The authors declare that the research was conducted in the absence of any commercial or financial relationships that could be construed as a potential conflict of interest.
Figures
References
-
- Hassapidou M, Vlassopoulos A, Kalliostra M, Govers E, Mulrooney H, Ells L, et al. European association for the study of obesity position statement on medical nutrition therapy for the management of overweight and obesity in adults developed in collaboration with the European federation of the associations of dietitians. Obes facts. (2023) 16:11–28. doi: 10.1159/000528083 - DOI - PMC - PubMed
MeSH terms
LinkOut - more resources
Full Text Sources
Medical