. 2024 Dec 19:8:24705470241304252.
doi: 10.1177/24705470241304252. eCollection 2024 Jan-Dec.

Cognitive Behavioral Therapy Reduces Unhelpful Thinking Among People with Musculoskeletal Symptoms: A Meta-Analysis

Affiliations

Cognitive Behavioral Therapy Reduces Unhelpful Thinking Among People with Musculoskeletal Symptoms: A Meta-Analysis

Deven Niraj Patel et al. Chronic Stress (Thousand Oaks). .

Abstract

Background: Greater unhelpful thinking is associated with greater musculoskeletal discomfort and incapability. Cognitive-behavioral therapy (CBT) fosters healthy thinking to help alleviate symptoms.

Questions: In a meta-analysis of randomized control trials (RCT) of CBT for unhelpful thinking among people with musculoskeletal symptoms, we asked: 1) Does CBT reduce unhelpful thinking and feelings of distress, and improve capability, in individuals with musculoskeletal symptoms? 2) Are outcomes affected by CBT delivery methods?

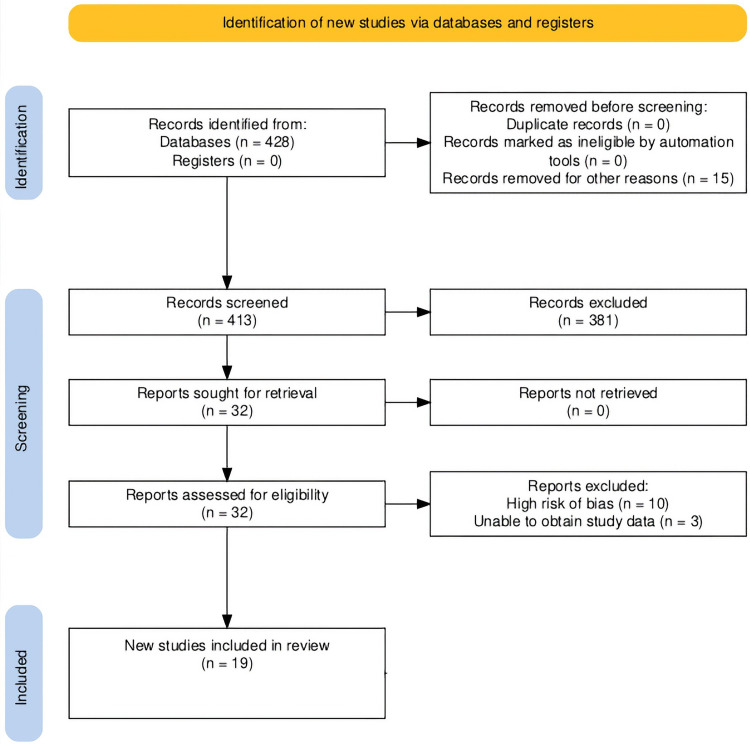
Methods: Following QUOROM guidelines, we searched databases using keywords of pain catastrophizing, kinesiophobia, cognitive-behavioral therapy, musculoskeletal and variations. Inclusion criteria were RCT's testing CBT among people with musculoskeletal symptoms. Study quality was assessed with Cochrane Review of Bias 2. Meta-analysis of means and standard deviations was performed.

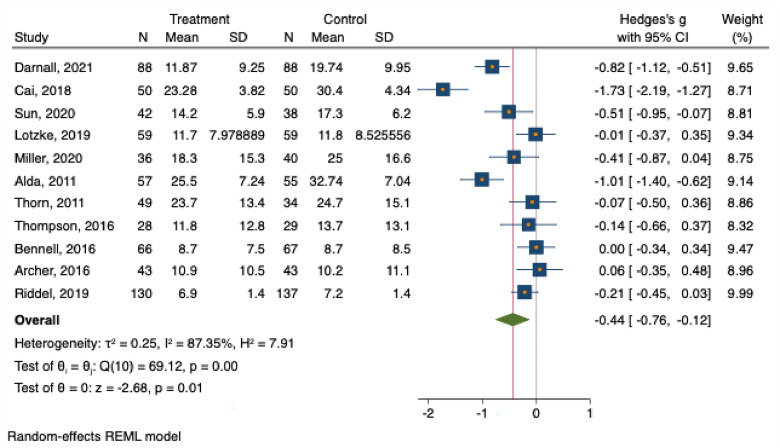
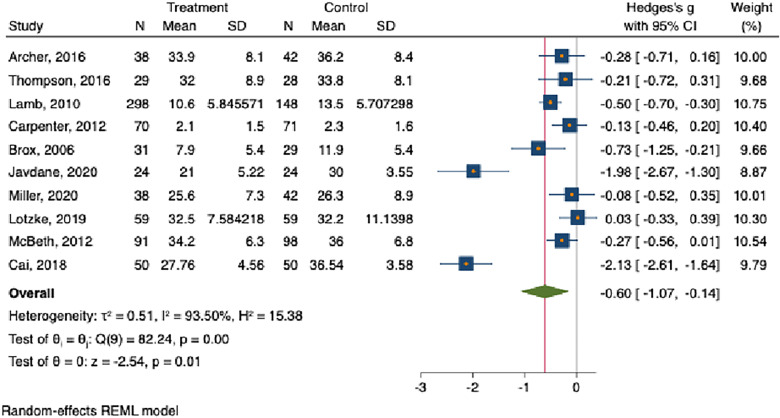
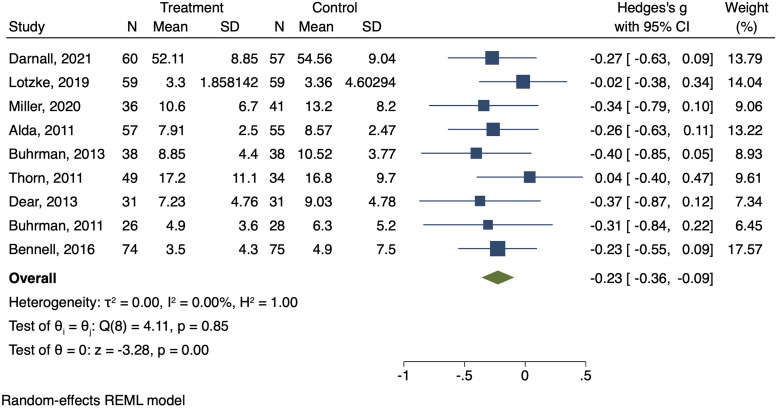
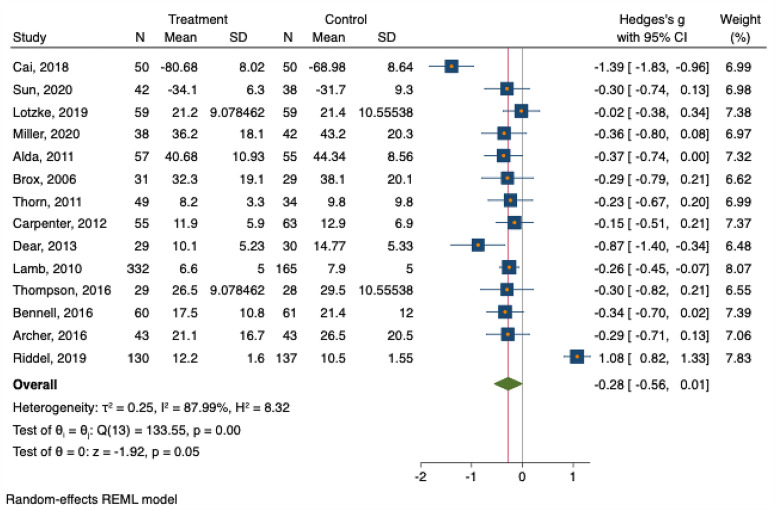
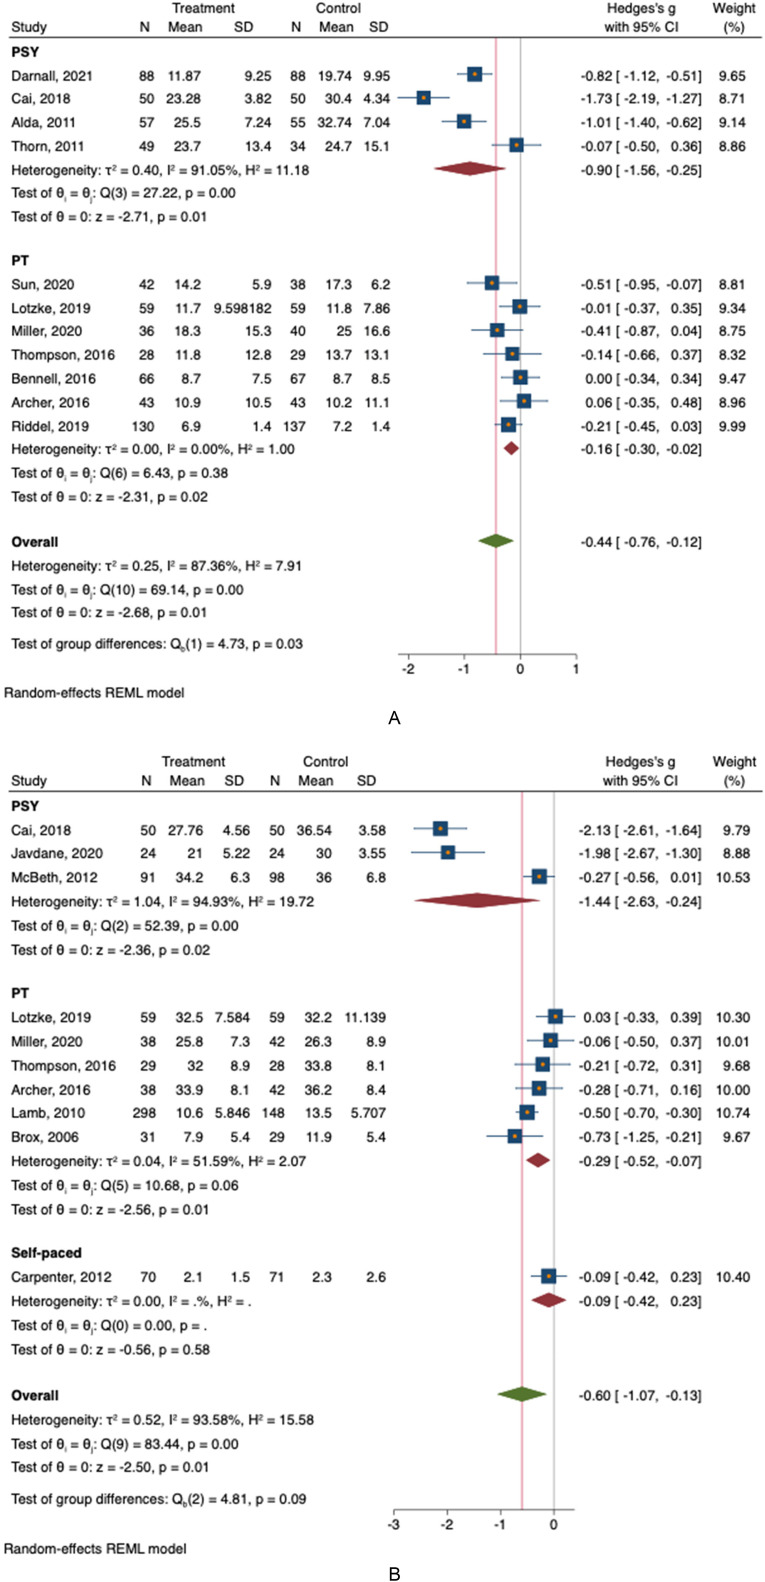
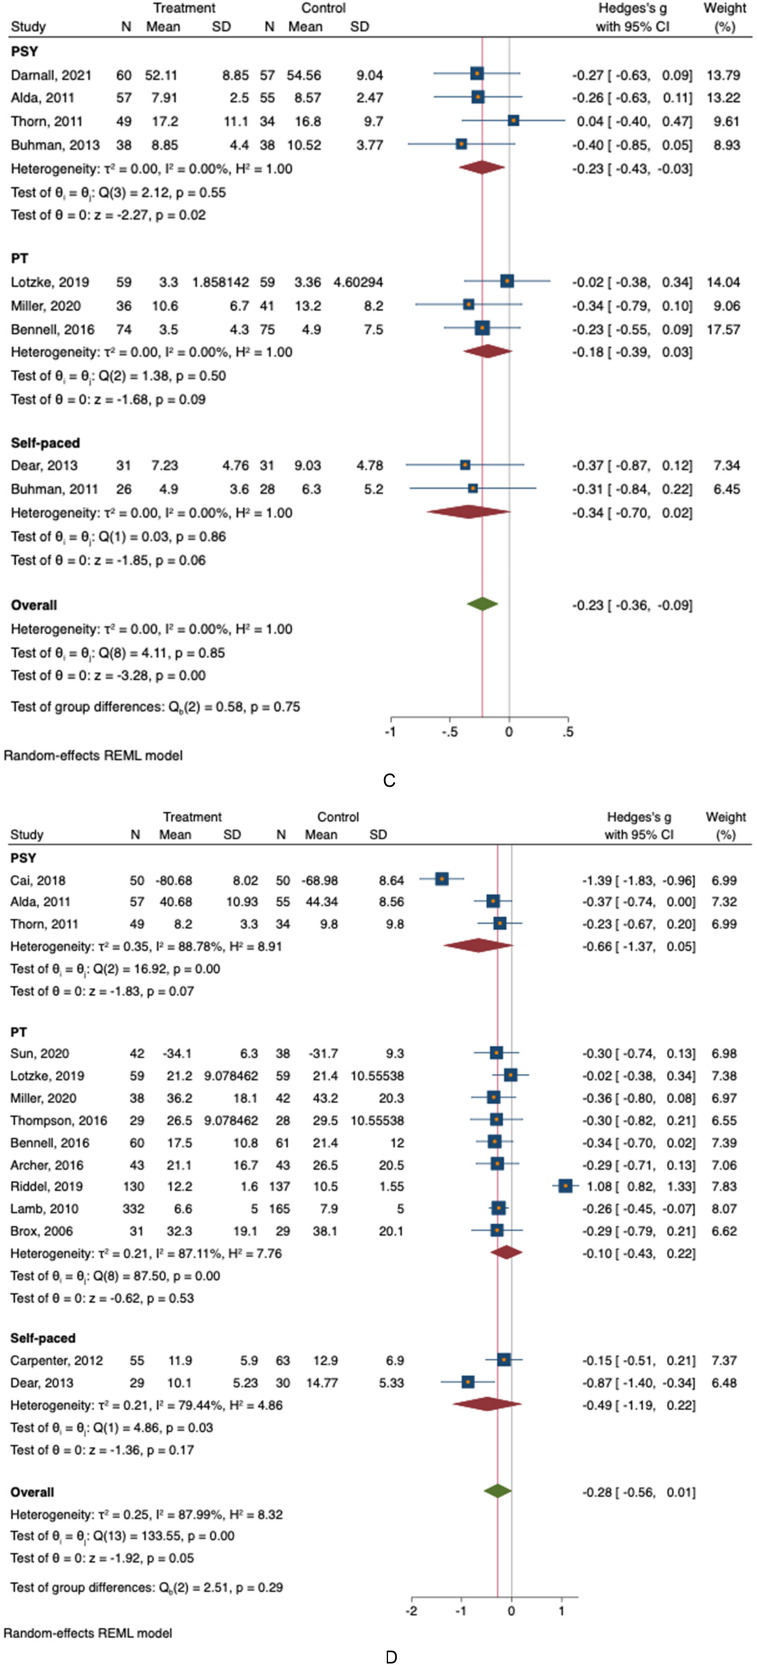
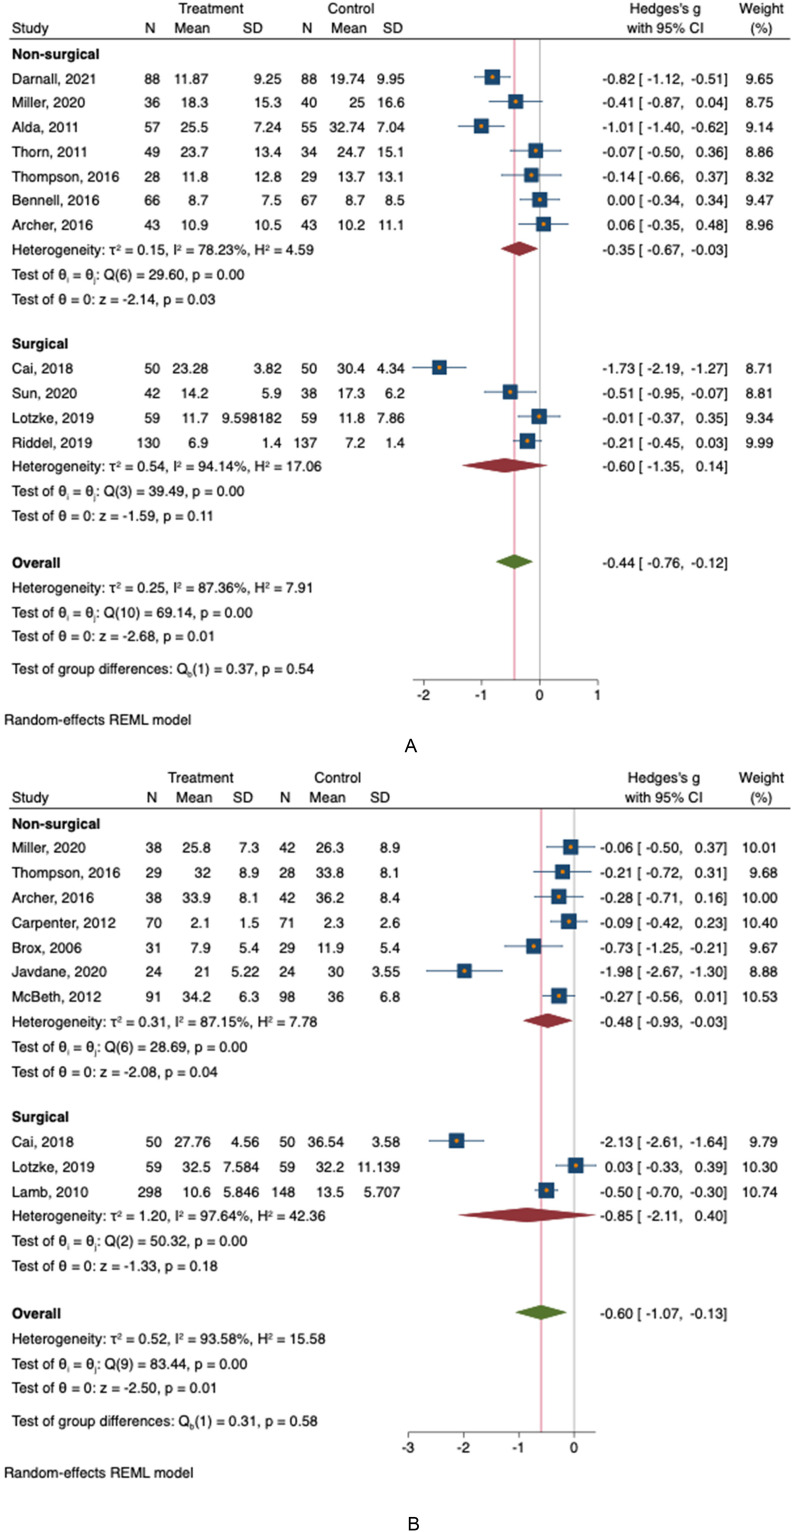
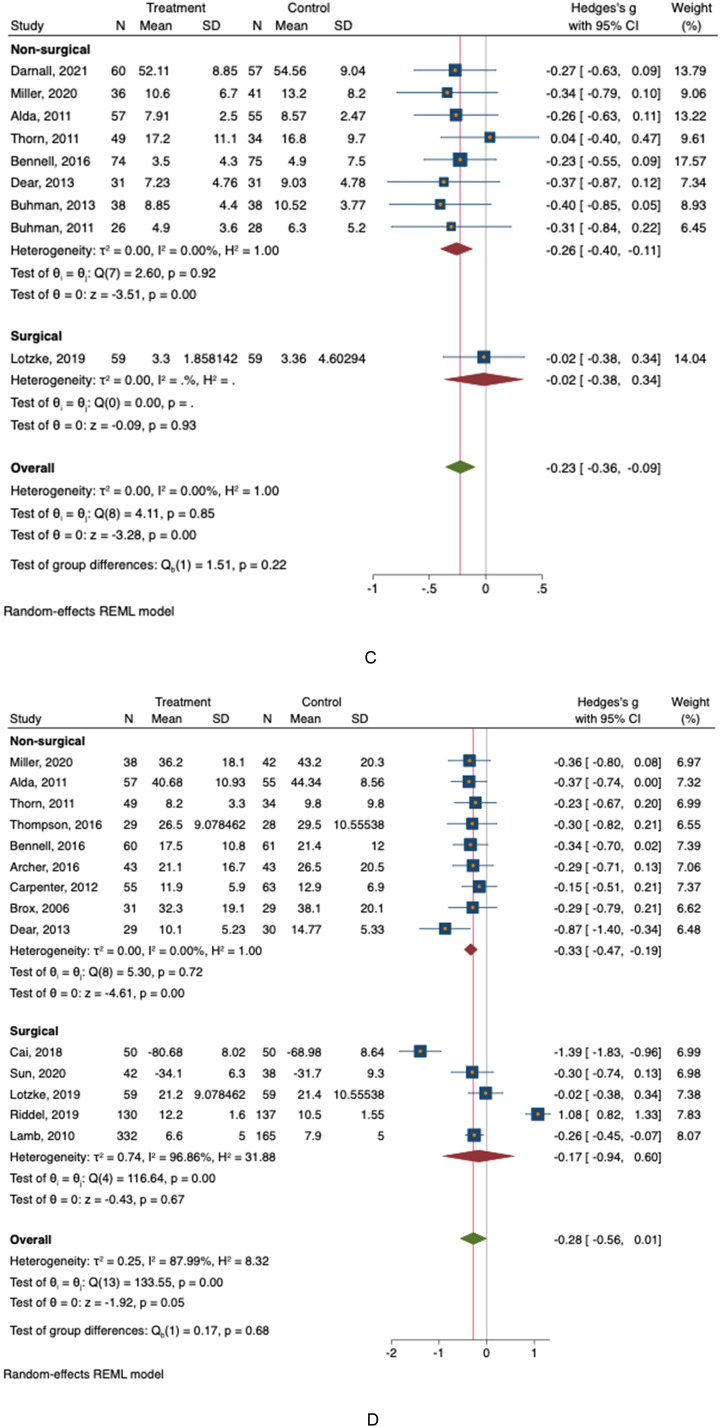
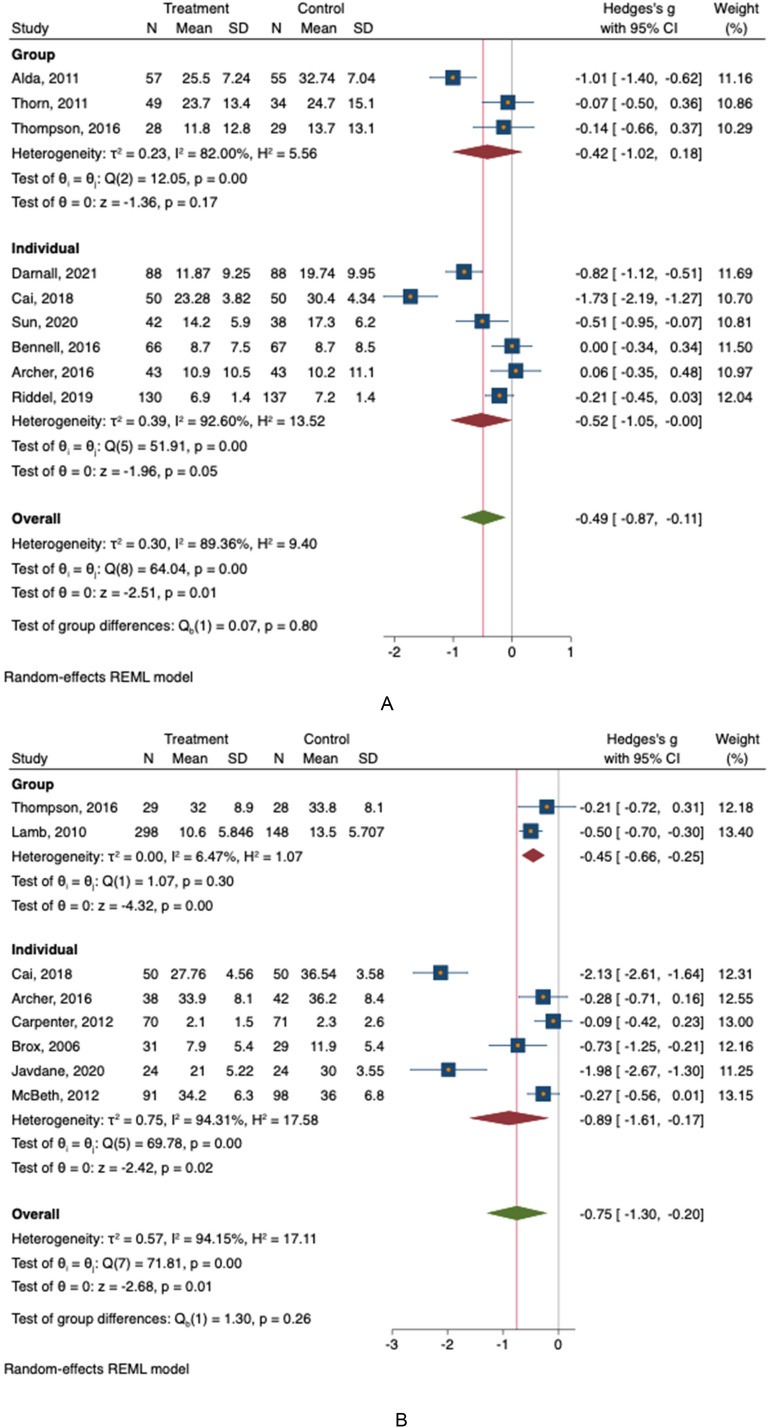
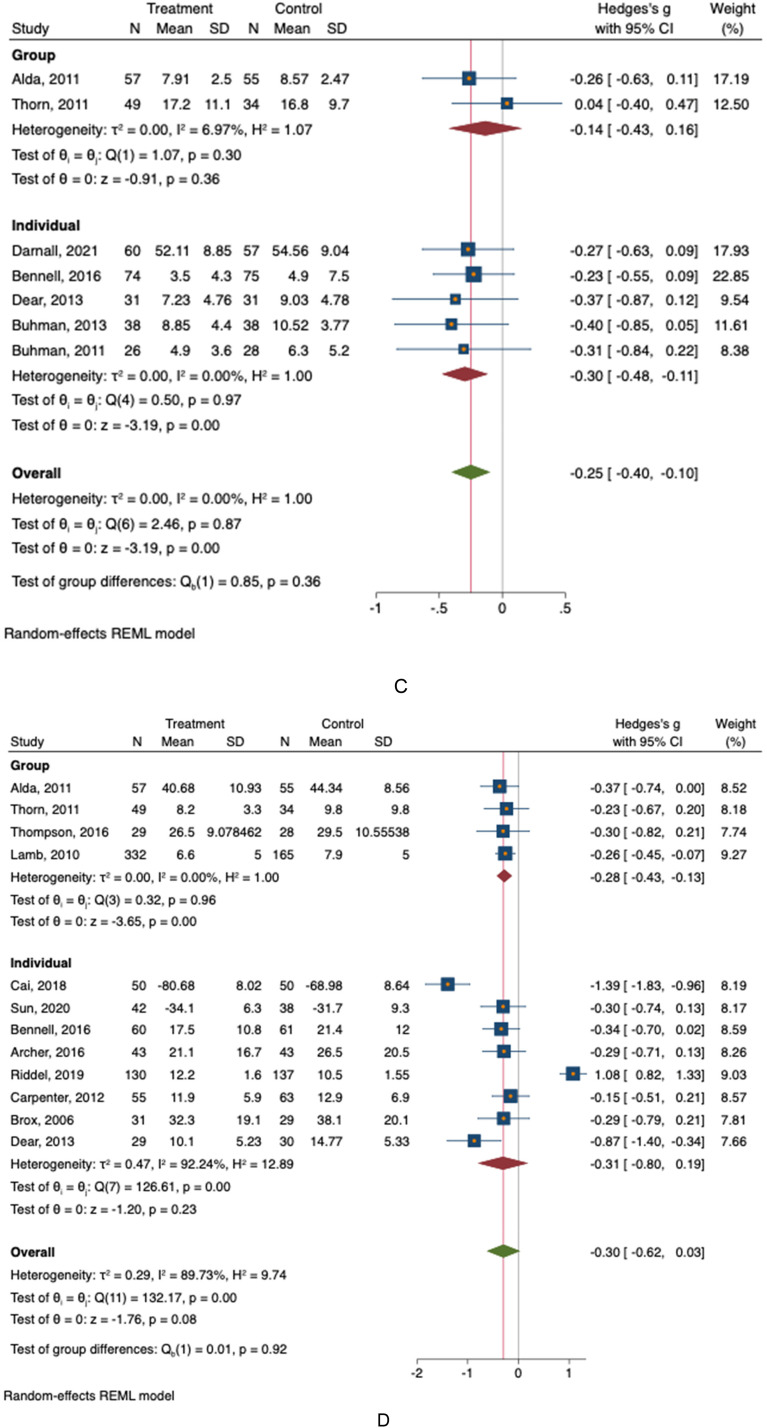
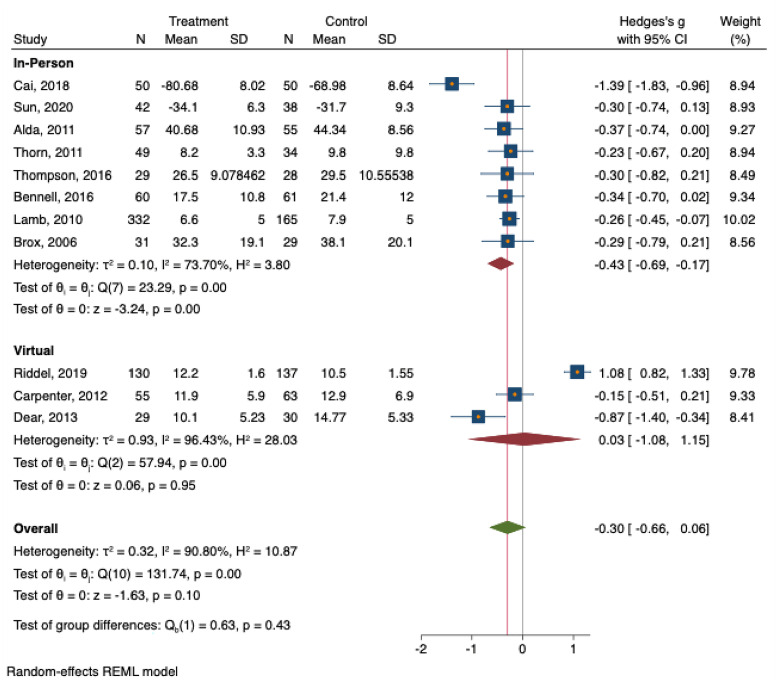
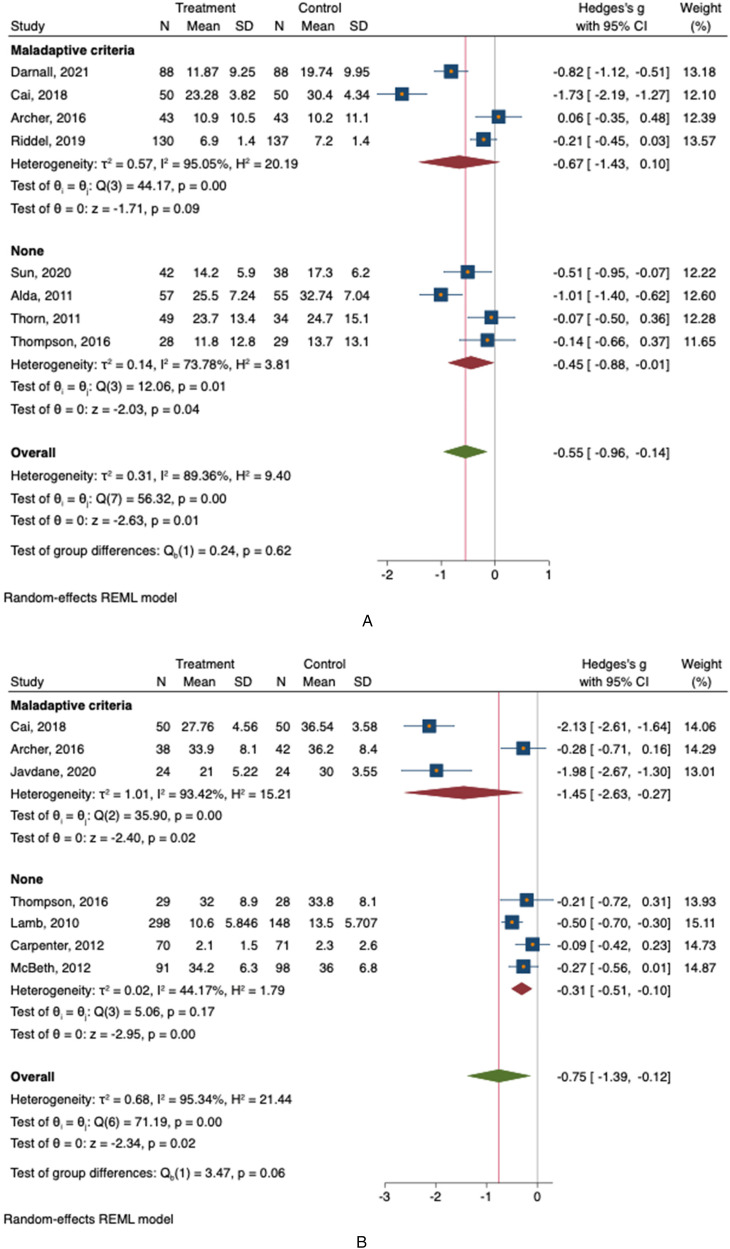
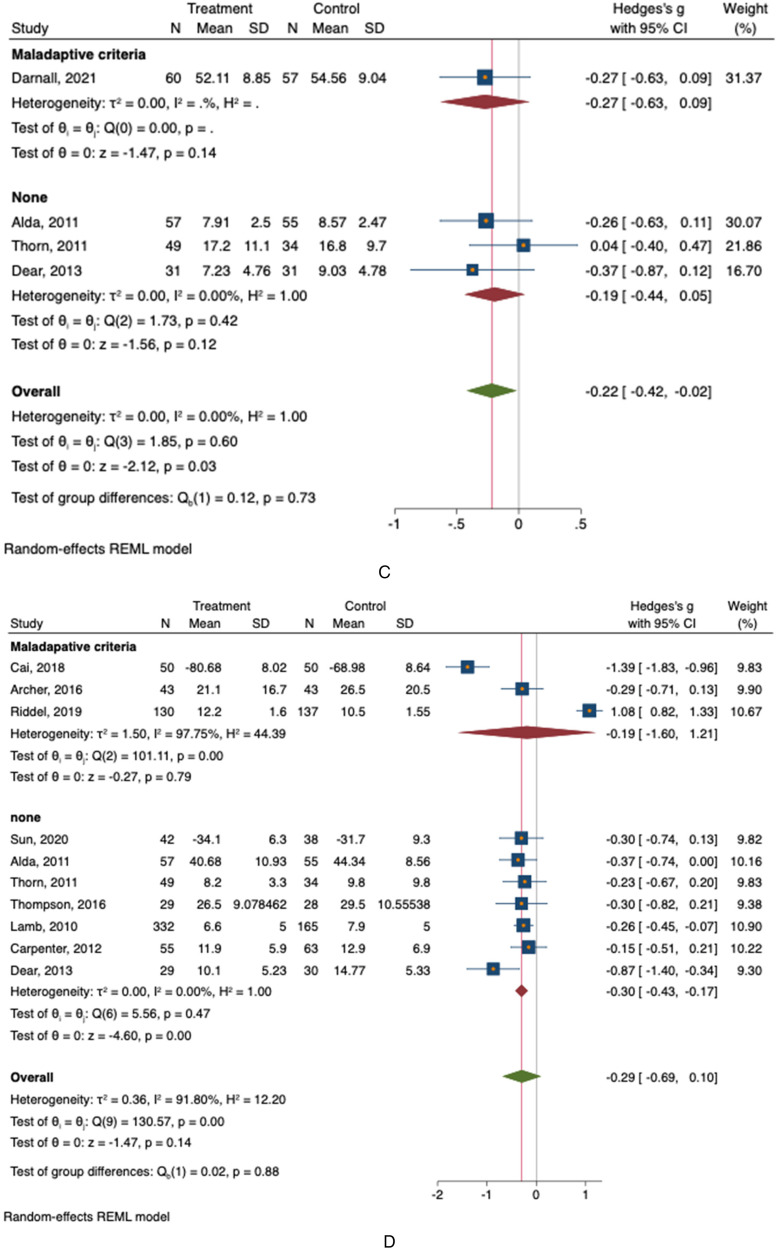
Results: CBT led to modest reductions in catastrophic thinking (-0.44 CI: -0.76 to -0.12; P = .01, kinesiophobia (-0.60 CI: -1.07 to -0.14; P = .01) and anxiety symptoms (-0.23 CI: -0.36 to -0.09; P < .01) over six months compared to usual care. There were no improvements in levels capability (-0.28 CI: -0.56 to 0.01; P = .05). CBT led by mental health professionals reduced catastrophic thinking more than CBT led by other clinicians (QB Test = 4.73 P = .03). There were no differences between online and in-person sessions, group versus individual therapy, or surgical versus non-surgical interventions.

Conclusion: The evidence that CBT delivered by various clinicians in various settings fosters healthier thinking in people presenting for care of musculoskeletal symptoms, supports comprehensive care of musculoskeletal illness. More research is needed to develop indications and interventions that also improve levels of capability. Level-I, meta-analysis of RCT's.

Keywords: anxiety symptoms; cognitive-behavioral therapy (CBT); fear avoidance; kinesiophobia; mental health interventions; pain catastrophizing; pain management; patient capability; recovery; unhelpful thinking.


Conflict of interest statement

Please separate ICMJE forms attached for each author details on conflicting interests.

Figures

Figure 1.
Figure 1.
This flowchart shows article selection according to the preferred reporting items for systematic reviews and Meta-analysis guidelines.
Figure 2.
Figure 2.
This forest plot shows the difference in pain catastrophizing scale score between groups treated with CBT compared with controls.
Figure 3.
Figure 3.
This forest plot shows the difference in levels of fear avoidance between groups treated with CBT compared with controls.
Figure 4.
Figure 4.
This forest plot shows the difference in levels of anxiety related to pain between groups treated with CBT compared with controls.
Figure 5.
Figure 5.
This forest plot shows the difference in outcomes related to function including strength, mobility, and activities of daily living between groups treated with CBT compared with controls.
Figure 6.
Figure 6.
A. This forest plot shows the difference in levels of catastrophic thinking when CBT is led by physical therapists versus mental health providers, each against usual care. N = sample size, SD = standard deviation, REML = restricted maximum likelihood. B. This forest plot shows the difference in levels of fear avoidance when CBT is led by physical therapists versus mental health providers, each against usual care. N = sample size, SD = standard deviation, REML = restricted maximum likelihood. C. This forest plot shows the difference in levels of symptoms of anxiety related to pain when CBT is led by physical therapists versus mental health providers, each against usual care. N = sample size, SD = standard deviation, REML = restricted maximum likelihood. D. This forest plot shows the difference in outcomes related to function including strength, mobility, and activities of daily living when CBT is led by physical therapists versus mental health providers, each against usual care. N = sample size, SD = standard deviation, REML = restricted maximum likelihood.
Figure 6.
Figure 6.
A. This forest plot shows the difference in levels of catastrophic thinking when CBT is led by physical therapists versus mental health providers, each against usual care. N = sample size, SD = standard deviation, REML = restricted maximum likelihood. B. This forest plot shows the difference in levels of fear avoidance when CBT is led by physical therapists versus mental health providers, each against usual care. N = sample size, SD = standard deviation, REML = restricted maximum likelihood. C. This forest plot shows the difference in levels of symptoms of anxiety related to pain when CBT is led by physical therapists versus mental health providers, each against usual care. N = sample size, SD = standard deviation, REML = restricted maximum likelihood. D. This forest plot shows the difference in outcomes related to function including strength, mobility, and activities of daily living when CBT is led by physical therapists versus mental health providers, each against usual care. N = sample size, SD = standard deviation, REML = restricted maximum likelihood.
Figure 7.
Figure 7.
A. This forest plot compares the impact of CBT on catastrophic thinking in patients treated with operative care versus patients treated with non-operative care, each against usual care interventions. N = sample size, SD = standard deviation, REML = restricted maximum likelihood. B. This forest plot compares the impact of CBT on fear avoidance in patients treated with operative care versus patients treated with non-operative care, each against usual care interventions. N = sample size, SD = standard deviation, REML = restricted maximum likelihood. C. This forest plot compares the impact of CBT on anxiety related to pain thoughts in patients treated with operative care versus patients treated with non-operative care, each against usual care interventions.
Figure 7.
Figure 7.
A. This forest plot compares the impact of CBT on catastrophic thinking in patients treated with operative care versus patients treated with non-operative care, each against usual care interventions. N = sample size, SD = standard deviation, REML = restricted maximum likelihood. B. This forest plot compares the impact of CBT on fear avoidance in patients treated with operative care versus patients treated with non-operative care, each against usual care interventions. N = sample size, SD = standard deviation, REML = restricted maximum likelihood. C. This forest plot compares the impact of CBT on anxiety related to pain thoughts in patients treated with operative care versus patients treated with non-operative care, each against usual care interventions.
Figure 8.
Figure 8.
A. This forest plot compares the impact of group CBT versus individual CBT sessions on catastrophic thinking, each against usual care interventions. B. This forest plot compares the impact of group CBT versus individual CBT sessions on fear avoidance, each against usual care interventions. C. This forest plot compares the impact of group CBT versus individual CBT sessions on anxiety related to pain, each against usual care interventions.
Figure 8.
Figure 8.
A. This forest plot compares the impact of group CBT versus individual CBT sessions on catastrophic thinking, each against usual care interventions. B. This forest plot compares the impact of group CBT versus individual CBT sessions on fear avoidance, each against usual care interventions. C. This forest plot compares the impact of group CBT versus individual CBT sessions on anxiety related to pain, each against usual care interventions.
Figure 9.
Figure 9.
This forest plot compares the impact of online CBT versus in-person CBT sessions on outcomes related to function, including strength, mobility, and activities of daily living, against usual care interventions.
Figure 10.
Figure 10.
A. This forest plot compares the impact of CBT on catastrophic thinking in populations screened for unhealthy mindsets versus those not screened, each against usual care interventions. B. This forest plot compares the impact of CBT on fear avoidance in populations screened for unhealthy mindsets versus those not screened, each against usual care interventions. C. This forest plot compares the impact of CBT on anxiety related to pain in populations screened for unhealthy mindsets versus those not screened, each against usual care interventions. D. This forest plot compares the impact of CBT on outcomes related to function, including strength, mobility, and activities of daily living, in populations screened for unhealthy mindsets versus those not screened, each against usual care interventions.
Figure 10.
Figure 10.
A. This forest plot compares the impact of CBT on catastrophic thinking in populations screened for unhealthy mindsets versus those not screened, each against usual care interventions. B. This forest plot compares the impact of CBT on fear avoidance in populations screened for unhealthy mindsets versus those not screened, each against usual care interventions. C. This forest plot compares the impact of CBT on anxiety related to pain in populations screened for unhealthy mindsets versus those not screened, each against usual care interventions. D. This forest plot compares the impact of CBT on outcomes related to function, including strength, mobility, and activities of daily living, in populations screened for unhealthy mindsets versus those not screened, each against usual care interventions.

Similar articles

References

    1. Archer KR, Wegener ST, Seebach C, et al. The effect of fear of movement beliefs on pain and disability after surgery for lumbar and cervical degenerative conditions. Spine (Phila Pa 1976). 2011. Sep;36(19): 1554–1562. - PubMed
    1. Browning RB, Clapp IM, Alter TD, Nwachukwu BU, Nho SJ. Pain catastrophizing and kinesiophobia affect return to sport in patients undergoing hip arthroscopy for the treatment of femoroacetabular impingement. Arthrosc Sports Med Rehabil [Internet]. 2021. Aug;3(4): e1087–e1095. Available from: 10.1016/j.asmr.2021.03.014 - DOI - PMC - PubMed
    1. Clapp IM, Nwachukwu BU, Beck EC, et al. What is the role of kinesiophobia and pain catastrophizing in outcomes after hip arthroscopy for femoroacetabular impingement syndrome? Arthrosc Sports Med Rehabil [Internet]. 2020;2(2): e97–104. Available from: 10.1016/j.asmr.2019.12.001 - DOI - PMC - PubMed
    1. Riddle DL, Keefe FJ, Ang DC, et al. Pain coping skills training for patients who catastrophize about pain prior to knee arthroplasty: A multisite randomized clinical trial. J Bone Joint Surg Am. 2019. Feb 6;101(3): 218–227. - PMC - PubMed
    1. Parrish JM, Jenkins NW, Parrish MS, et al. The influence of cognitive behavioral therapy on lumbar spine surgery outcomes: A systematic review and meta-analysis. Eur Spine J. 2021;30(5):1365–1379. Springer Science and Business Media Deutschland GmbH. - PubMed

LinkOut - more resources