. 2024 Dec 6:18:1471132.
doi: 10.3389/fnhum.2024.1471132. eCollection 2024.

Development and validation of a two-dimensional pseudorandom balance perturbation test

Affiliations

Development and validation of a two-dimensional pseudorandom balance perturbation test

Andrew R Wagner et al. Front Hum Neurosci. .

Abstract

Introduction: Pseudorandom balance perturbations use unpredictable disturbances of the support surface to quantify reactive postural control. The ability to quantify postural responses to a continuous multidirectional perturbation in two orthogonal dimensions of sway (e.g., AP and ML) has yet to be investigated.

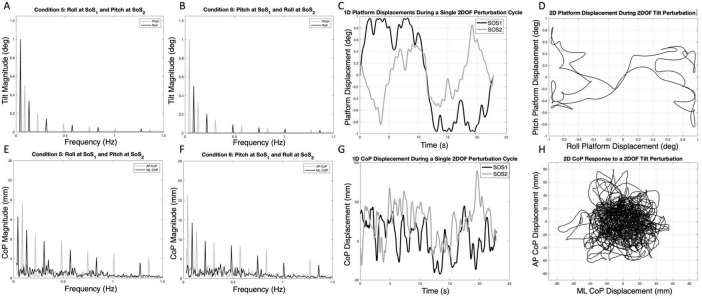
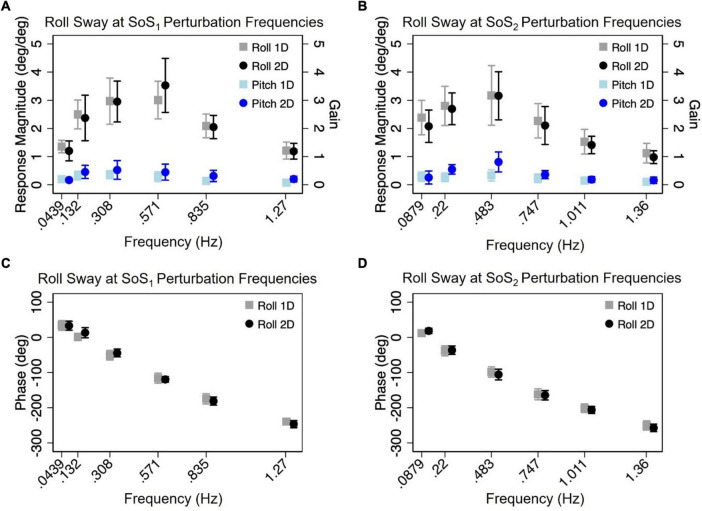
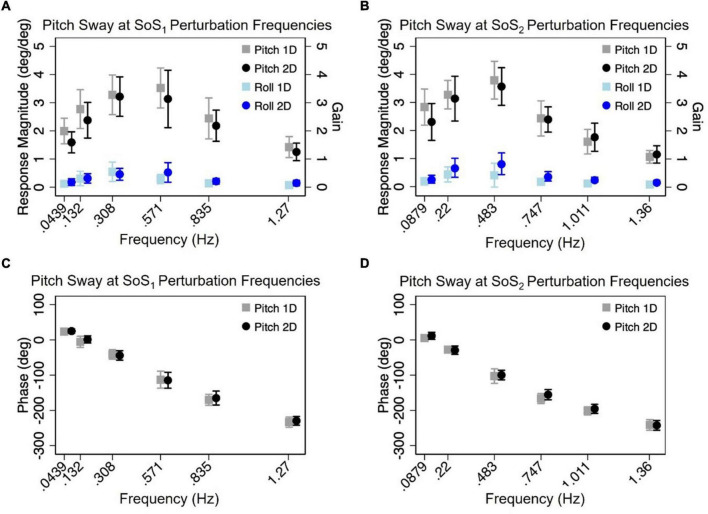
Methods: We developed a balance perturbation paradigm that used two spectrally independent sum of sinusoids signals (SoS1, SoS2), one for each orthogonal dimension of tilt (roll and pitch), to deliver a two-dimensional (2D) balance perturbation. In a group of 10 healthy adults we measured postural sway during 2D perturbations, as well as for each of the two individual 1D perturbation components.

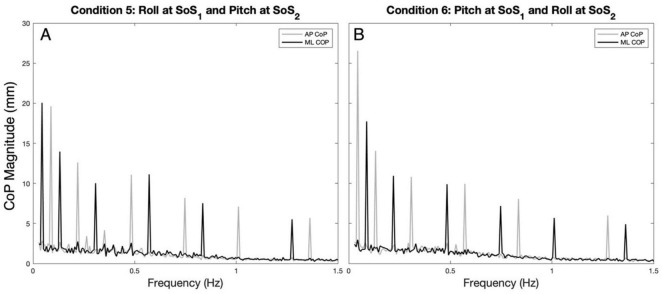
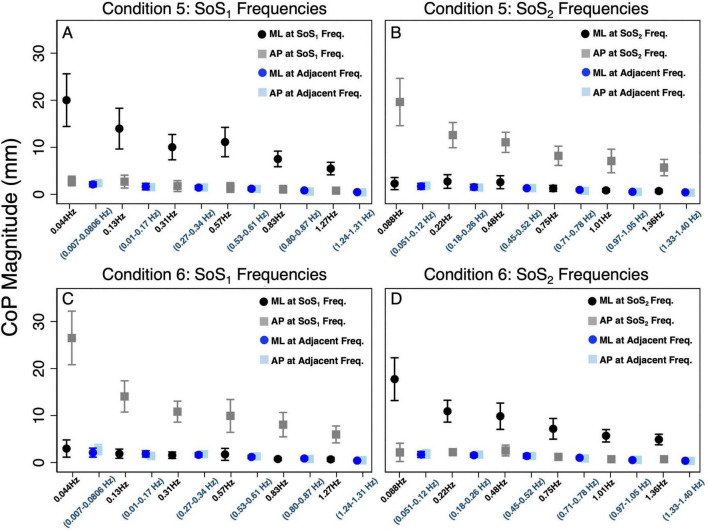
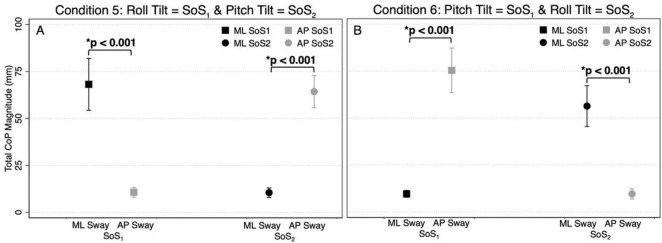
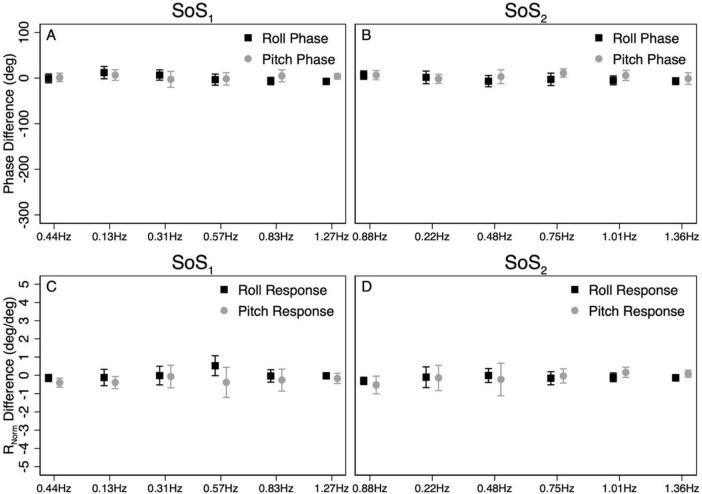
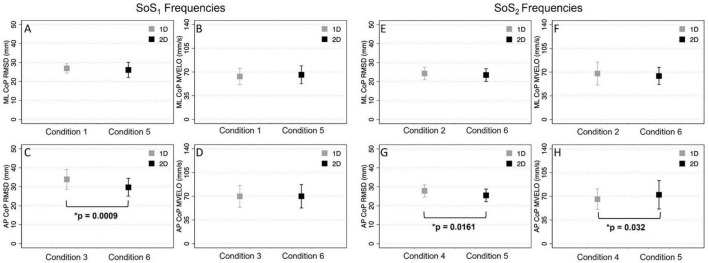
Results: We found that during 2D perturbations, spectral peaks in the sway response were larger at the perturbed frequencies when compared to (1) the adjacent non-perturbed frequencies and (2) the frequencies contained within the orthogonal, spectrally independent perturbation signal. We also found that for each of the two spectra (SoS1, SoS2), the magnitude and timing of the sway response relative to the platform disturbance was similar when measured during 1D and 2D conditions.

Discussion: These data support that our novel 2D SoS perturbation test was able to evoke ML and AP postural responses that were (1) specific to the roll and pitch perturbations, respectively, and (2) similar to the responses provoked by individual 1D perturbations.

Keywords: balance; multidimensional; perturbation; postural control; vestibular.


Conflict of interest statement

The authors declare that the research was conducted in the absence of any commercial or financial relationships that could be construed as a potential conflict of interest.

Figures

FIGURE 1
FIGURE 1
The spectral magnitude of the roll (black) and pitch (gray) perturbation signals are shown for each of the 2D perturbations — Condition 5 (A) and Condition 6 (B). The spectral magnitudes of the mediolateral (ML, black) and anteroposterior (AP, gray) center of pressure (CoP) responses are also shown for a single participant in each condition (E,F). The one-dimensional roll and pitch displacement time series of the platform during a two-dimensional perturbation (Condition 5) is shown in (C); here, the SOS1 signal (black) is a roll tilt, and the SOS2 signal (gray) is a pitch tilt. Exemplar one-dimensional (1D) mediolateral and anteroposterior CoP responses to the SOS1 and SOS2 perturbations are also shown in (G). The same data from (C,G) are shown as two-dimensional plots to demonstrate the two-dimensional travel of the platform (D) and the corresponding motion of the CoP for a single cycle of motion (H). Spectral plots [as are shown in (E,F)] for each of the 10 participants are provided in Supplementary Figures 2, 3.
FIGURE 2
FIGURE 2
The average (across participants) anteroposterior (AP, gray) and mediolateral (ML, black) CoP spectral magnitudes are shown for the 2D perturbation conditions, Condition 5 (A) and Condition 6 (B). The spectral peaks occur at the frequencies (fSoS1 and fSoS2) of the two unique sum of sinusoids perturbation signals (SoS1 and SoS2).
FIGURE 3
FIGURE 3
The average (across participants) anteroposterior (AP, gray square) and mediolateral (ML, black circle) CoP spectral magnitudes are shown for each of the stimulated frequencies in the 2D perturbation conditions. (A,B) show CoP magnitudes for Condition 5 at the SoS1 frequencies and SoS2 frequencies, respectively. (C,D) show CoP magnitudes for Condition 6 at the SoS1 frequencies and SoS2 frequencies, respectively. In each plot, the average AP (light blue square) and ML (blue circle) sway at adjacent frequencies is also shown. The adjacent sway response represents the median of the CoP magnitudes surrounding the individual perturbation frequency (± 0.073 Hz). Error bars show +/– 1 SD.
FIGURE 4
FIGURE 4
The total CoP magnitudes—summed across frequency — are shown for mediolateral (ML, black) and anteroposterior (AP, gray) postural sway in the 2D perturbation conditions, Condition 5 (A) and Condition 6 (B). The left side of each plot shows the mean CoP magnitude (across participants) at the SoS1 frequencies (denoted by squares), and the right side of each plot shows the mean CoP magnitude at the SoS2 frequencies (denoted by circles). Error bars show ± 1SD. Results of paired t-tests comparing the total ML and AP CoP magnitudes are shown.
FIGURE 5
FIGURE 5
The mean (across participants) normalized response magnitudes (A,B) and phases (C,D) of the center of mass (CoM) in the roll plane are shown for the 2D (black circle) and 1D (gray square) roll perturbation conditions, at each of the individual fSoS1 (A,C) and fSoS2 (B,D) frequencies. The magnitudes of the off-axis pitch plane responses at the roll perturbation frequencies are also shown for 1D (light blue square) and 2D (blue circle) conditions. Error bars show ± 1SD surrounding the mean.
FIGURE 6
FIGURE 6
The mean (across participants) normalized response magnitudes (A,B) and phases (C,D) of the center of mass (CoM) in the pitch plane are shown for the 2D (black circle) and 1D (gray square) pitch perturbation conditions, at each of the individual fSoS1 (A,C) and fSoS2 (B,D) frequencies. The magnitudes of the off-axis roll plane responses at the pitch perturbation frequencies are also shown for 1D (light blue square) and 2D (blue circle) conditions. Error bars show ± 1SD surrounding the mean.
FIGURE 7
FIGURE 7
The average difference in CoM phase between 1D and 2D conditions for the SoS1 (A) and SoS2 (B) perturbation stimuli are shown. For each participant, the differences in phase between the 2D and 1D conditions were calculated at each of the six perturbation frequencies. The average phase difference was then calculated by taking the average across the six perturbation frequencies. To demonstrate the magnitude of the phase differences relative to the calculated phase values, the scaling of the y-axis was matched to Figures 5, 6. Average differences in the normalized response magnitude (RNorm) at each frequency were also calculated using identical methods (C,D). Error bars show ± 1SD.
FIGURE 8
FIGURE 8
The root mean square distance (RMSD) and mean velocity (MVELO) of the center of pressure (CoP) are shown for each 1D (gray) and 2D (black) condition. Each plot shows the group mean ± 1SD. The two left columns (A,B,C,D) show comparisons for conditions that included a perturbation stimulus with power at the SoS1 frequencies. The two right columns (E,F,G,H) show comparisons for conditions that included a perturbation stimulus with power at the SoS2 frequencies. Significant differences (p < 0.05) are shown.

Similar articles

References

    1. Agrawal Y., Carey J. P., Hoffman H. J., Sklare D. A., Schubert M. C. (2011). The modified Romberg Balance Test: Normative data in U.S. adults. Otol. Neurotol. 32 1309–1311. 10.1097/MAO.0b013e31822e5bee - DOI - PMC - PubMed
    1. Allum J. H., Oude Nijhuis L. B., Carpenter M. G. (2008). Differences in coding provided by proprioceptive and vestibular sensory signals may contribute to lateral instability in vestibular loss subjects. Exp. Brain Res. 184 391–410. 10.1007/s00221-007-1112-z - DOI - PubMed
    1. Bloem B. R., Allum J. H., Carpenter M. G., Honegger F. (2000). Is lower leg proprioception essential for triggering human automatic postural responses? Exp. Brain Res. 130 375–391. 10.1007/s002219900259 - DOI - PubMed
    1. Bloem B. R., Allum J. H., Carpenter M. G., Verschuuren J. J., Honegger F. (2002). Triggering of balance corrections and compensatory strategies in a patient with total leg proprioceptive loss. Exp. Brain Res. 142 91–107. 10.1007/s00221-001-0926-3 - DOI - PubMed
    1. Campbell K. R., King L. A., Parrington L., Fino P. C., Antonellis P., Peterka R. J. (2022). Central sensorimotor integration assessment reveals deficits in standing balance control in people with chronic mild traumatic brain injury. Front. Neurol. 13:897454. 10.3389/fneur.2022.897454 - DOI - PMC - PubMed

LinkOut - more resources