[Preprint]. 2024 Dec 11:2024.12.09.627617.
doi: 10.1101/2024.12.09.627617.

H3.1K27M-induced misregulation of the TSK/TONSL-H3.1 pathway causes genomic instability

Affiliations

H3.1K27M-induced misregulation of the TSK/TONSL-H3.1 pathway causes genomic instability

Wenxin Yuan et al. bioRxiv. .

Update in

Abstract

The oncomutation lysine 27-to-methionine in histone H3 (H3K27M) is frequently identified in tumors of patients with diffuse midline glioma-H3K27 altered (DMG-H3K27a). H3K27M inhibits the deposition of the histone mark H3K27me3, which affects the maintenance of transcriptional programs and cell identity. Cells expressing H3K27M are also characterized by defects in genome integrity, but the mechanisms linking expression of the oncohistone to DNA damage remain mostly unknown. In this study, we demonstrate that expression of H3.1K27M in the model plant Arabidopsis thaliana interferes with post-replicative chromatin maturation mediated by the H3.1K27 methyltransferases ATXR5 and ATXR6. As a result, H3.1 variants on nascent chromatin remain unmethylated at K27 (H3.1K27me0), leading to ectopic activity of TONSOKU (TSK), which induces DNA damage and genomic alterations. Elimination of TSK activity suppresses the genome stability defects associated with H3.1K27M expression, while inactivation of specific DNA repair pathways prevents survival of H3.1K27M-expressing plants. Overall, our results suggest that H3.1K27M disrupts the chromatin-based mechanisms regulating TSK/TONSL activity, which causes genomic instability and may contribute to the etiology of DMG-H3K27a.


Conflict of interest statement

Ethics declarations The authors declare no competing interests.

Figures

Figure 1.
Figure 1.. H3.1K27M expression induces developmental defects and DNA damage in Arabidopsis.
A Relative abundance of H3.1 gene transcripts. B Morphological phenotypes of Col-0, H3.1 WT and H3.1K27M plants. C Survival rates of Col-0, H3.1 WT and H3.1K27M plants. D Representative comet assay images. E Quantification of DNA percentage in the comet tails. Horizontal bars indicate the mean. Welch’s ANOVA followed by the Dunnett’s T3 test: **** p < 0.0001, ns = not significantly different. F Relative root length of seedlings grown on ½ MS plates with 100 μg/ml MMS compared to the average root length of seedlings grown on plates without MMS. Each dot represents one individual T1 plant. Horizontal bars indicate the mean. SEM is shown. One-way ANOVA with Tukey’s multiple comparison test: **** p < 0.0001, ns = not significantly different. G Representative image of histochemical staining of reporter plants for GUS activity. Blue areas indicate that a functional reporter gene has been restored via a somatic recombination event. H RNA-seq data showing relative transcript levels of 158 DNA damage response genes (Table S1) measured by transcripts per million (TPM). Wilcoxon test with Bonferroni correction: **** p < 0.0001, ns = not significantly different.
Figure 2.
Figure 2.. H3.1K27M-expressing plants exhibit loss of ATXR5/6-mediated H3K27me1.
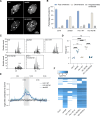
A Staining of leaf nuclei with an anti-H3K27me3 antibody and DAPI. B ChIP-seq profiles and heatmaps of normalized H3K27me3 signal over protein-coding genes grouped by level of expression (< 5 and > 5 TPM) in reference-adjusted reads per million (RRPM). TSS, transcription start site. C ChIP-Rx normalized H3K27me1 signal using 100 kb windows over chr 5. The pericentromeric region is shown in gray. D to F Staining of leaf nuclei with anti-H3K27M and anti-H3K27me1 (D and E) or anti-H3K27me3 antibodies (F) and DAPI. G and H Relative Western blot quantification of H3K27me1 (G) and H3K27me3 (H) levels in leaf total histones. One-way ANOVA with Tukey’s multiple comparison test: *** p < 0.001, ns = not significantly different. I Representative in vitro histone methyltranferase assay using ATXR6 and recombinant nucleosomes containing plant H3.1-strep. Nucleosomes containing H3K27M or H3K27A (H3 inhibitor) were added to the reactions. J Quantification of the relative amount of 3H-SAM incorporated into the H3.1-strep substrate. Each dot represents one independent experiment. Bars represent the mean. SEM is shown. One-way ANOVA with Tukey’s multiple comparison test: ** p = 0.0040, * p = 0.0459, ns = not significantly different.
Figure 3.
Figure 3.. H3.1K27M induces heterochromatin defects similarly to atxr5/6 mutants.
A Leaf interphase nuclei stained with DAPI. B Quantification of chromocenter appearance of nuclei from experiment in panel A. C Flow cytometry profiles of leaf nuclei stained with propidium iodide (PI). Ploidy levels of the nuclei are shown below the peaks. The numbers above the 16C peaks indicate the robust coefficient of variation (CV). D Robust CV quantification of 16C peaks. Each dot represents an individual plant. The mean is shown. One-way ANOVA with Tukey’s multiple comparison test: **** p < 0.0001, ns = not significantly different. E Chromosomal view (Chr 5) of DNA-seq reads. The pericentromeric region is highlighted in gray. F Heat map showing the relative expression levels of TEs induced in H3.1K27M plants (Table S2).
Figure 4.
Figure 4.. H3.1K27M causes genomic instability by inducing ectopic TSK activity.
A and B Morphological phenotypes of Col-0, tsk, H3.1 WT, H3.1K27M, tsk/H3.1 WT and tsk/H3.1K27M plants. C Chromosomal view (Chr 5) of DNA-seq reads. The pericentromeric region is highlighted in gray. D Immunostaining of leaf nuclei with anti-H3K27M and anti-H3K27me1 antibodies. DNA is stained with DAPI. E Western blot quantification showing relative H3K27me1 levels in total histones extracted from leaves. One-way ANOVA with Tukey’s multiple comparison test: *** p < 0.001, ns = not significantly different. F Staining of leaf nuclei with an anti-H3K27me3 antibody and DAPI. G Peptide pull-down assay using the TPR domain of TSK (TSKTPR) and GST-tagged histone peptides (aa 1 to 58). H Domain architecture of plant and animal TSK/TONSL. TPR: Tetratricopeptide Repeats, ARD: Ankyrin Repeat Domain, LRR: Leucine-Rich Repeats. I and J Pull-down assay with TPR + ARD domains (TONSLTPR + ARD) (I) or the TONSL TPR domain only (TONSLTPR) (J) with GST-tagged histone peptides (aa 1 to 58). K Pull-down assay of TONSLTPR + ARD with biotinylated recombinant nucleosomes.
Figure 5.
Figure 5.. Differential effects of H3.1K27M expression in DNA repair mutants.
A and B Genotypes of T1 transgenic plants resulting from transformation of H3.1 WT and H3.1K27M into rad51 heterozygous (rad51 [+/−]) (A) and mre11 heterozygous (mre11 [+/−]) (B) T0 plants. C and D Chromosomal view (Chr 5) of DNA-seq reads. The pericentromeric region is highlighted in gray. E Model depicting how H3.1K27M expression leads to genomic instability by increasing the levels of H3.1K27me0, which causes misregulation of TSK.

Similar articles

References

    1. Louis D. N. et al., cIMPACT-NOW update 2: diagnostic clarifications for diffuse midline glioma, H3 K27M-mutant and diffuse astrocytoma/anaplastic astrocytoma, IDH-mutant. Acta Neuropathol 135, 639–642 (2018). - PubMed
    1. Schwartzentruber J. et al., Driver mutations in histone H3.3 and chromatin remodelling genes in paediatric glioblastoma. Nature 482, 226–231 (2012). - PubMed
    1. Wu G. et al., Somatic histone H3 alterations in pediatric diffuse intrinsic pontine gliomas and non-brainstem glioblastomas. Nat Genet 44, 251–253 (2012). - PMC - PubMed
    1. Castel D. et al., Histone H3F3A and HIST1H3B K27M mutations define two subgroups of diffuse intrinsic pontine gliomas with different prognosis and phenotypes. Acta Neuropathol 130, 815–827 (2015). - PMC - PubMed
    1. Bender S. et al., Reduced H3K27me3 and DNA hypomethylation are major drivers of gene expression in K27M mutant pediatric high-grade gliomas. Cancer Cell 24, 660–672 (2013). - PubMed

Publication types