[Preprint]. 2024 Dec 12:2024.12.11.627970.
doi: 10.1101/2024.12.11.627970.

RNA encodes physical information

Affiliations

RNA encodes physical information

Ian Seim et al. bioRxiv. .

Abstract

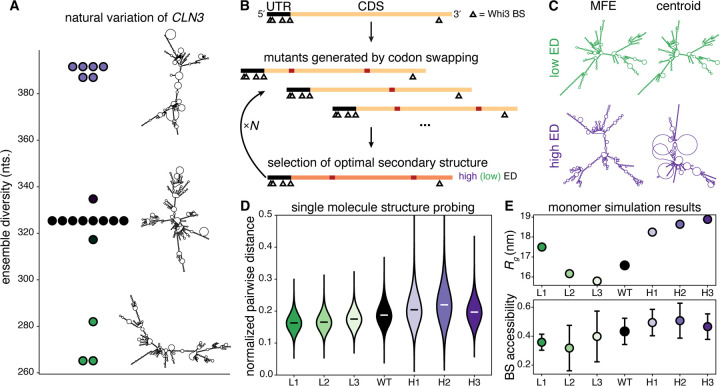
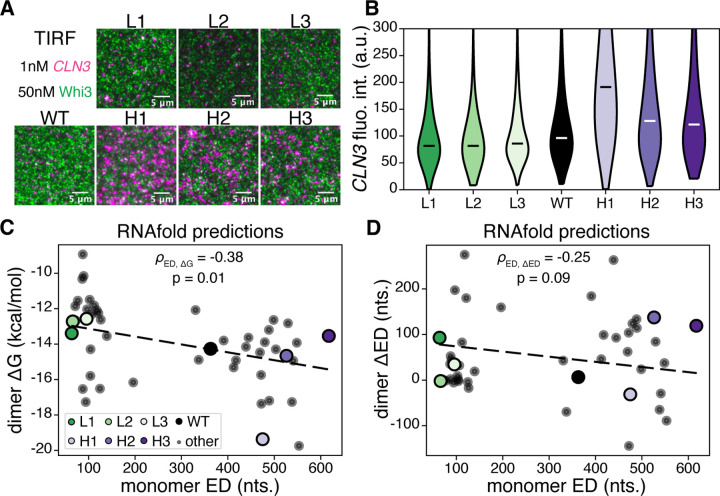
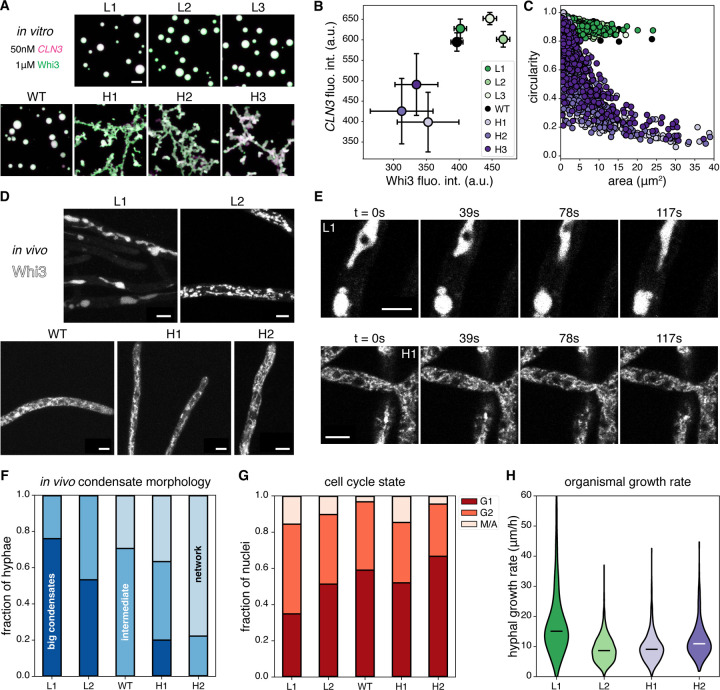
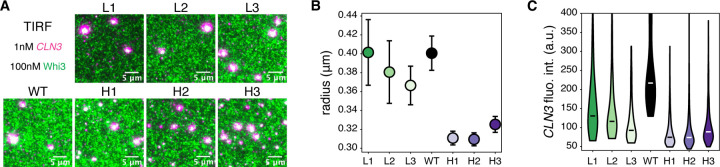
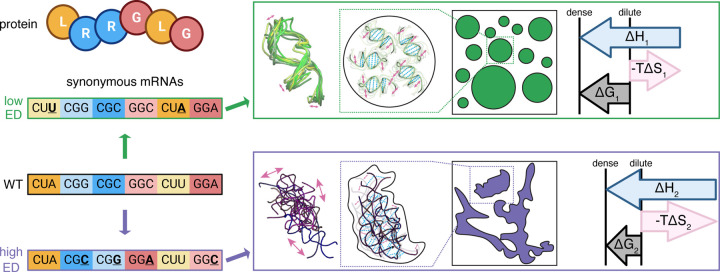
Most amino acids are encoded by multiple codons, making the genetic code degenerate. Synonymous mutations affect protein translation and folding, but their impact on RNA itself is often neglected. We developed a genetic algorithm that introduces synonymous mutations to control the diversity of structures sampled by an mRNA. The behavior of the designed mRNAs reveals a physical code layered in the genetic code. We find that mRNA conformational heterogeneity directs physical properties and functional outputs of RNA-protein complexes and biomolecular condensates. The role of structure and disorder of proteins in biomolecular condensates is well appreciated, but we find that RNA conformational heterogeneity is equally important. This feature of RNA enables both evolution and engineers to build cellular structures with specific material and responsive properties.

Keywords: RNA structure; biomolecular condensates; biopolymers; ensemble diversity; information theory; synonymous mutation.


Conflict of interest statement

Competing interests: The authors declare no competing interests.

Figures

Figure 1:
Figure 1:. Design of RNA structural ensembles.
(A) CLN3 mRNAs in Ashbya gossypii wild isolates have different sequences and sample a range of predicted ensemble diversities (ED). Representative centroid structures are shown to the right of the plot points. (B) Top: A schematic of the CLN3 transcript is shown in which the lengths of the 5′ UTR and the coding sequence (CDS) and the positions of the Whi3 binding sites (BS) are drawn to scale. Middle: Several mutant sequences are generated by random synonymous mutations within the CDS by swapping codons subject to the constraints described in the text. Bottom: The mutant sequence with the maximum (minimum) predicted ED is chosen as the parent of the next generation. This process is iterated N times until a sequence with desired properties is found. (C) Secondary structure predictions of the minimum free energy (MFE) and centroid structures from designed sequences L3 (top) and H3 (bottom) at 25°C and 150mM NaCl are shown. (D) The normalized pairwise distances among the longest 1000 reads for each sequence are shown. White and black bars represent medians. All distributions are significantly different based on the Mann-Whitney U test with p < 0.01. (E) Top: Predicted radius of gyration (Rg) from simulations for each sequence. Error bars are smaller than markers. Bottom: Predicted average Whi3 binding site (BS) solvent accessibility from simulations for each sequence. Error bars represent standard deviations of accessibility among the 5 BS for each sequence.
Figure 2:
Figure 2:. RNA ED controls composition of subsaturated RNA-protein assemblies.
(A) Total internal reflection fluorescence (TIRF) microscopy was performed to visualize subsaturated clusters of CLN3 structural mutants and Whi3 protein. Magenta corresponds to CLN3, and green corresponds to Whi3. Scale bars are 5μm. (B) Distributions of puncta intensities from the data represented in panel (A) are shown. White and black bars indicate medians. All distributions are significantly different based on the Mann-Whitney U test with p < 0.01. (C) RNAfold predictions of dimer ΔG, defined in the text, versus monomer ED, for the CLN3 structure mutants and 40 additional designed sequences (“other” in legend) are shown. ρED,ΔG is the Pearson’s correlation coefficient, and p is the associated p-value. (D) The same sequences are analyzed as in (C) but for dimer ΔED and monomer ED. ρED,ΔED is the Pearson’s correlation coefficient between monomer ED and dimer ΔED.
Figure 3:
Figure 3:. Upon phase separation, RNA ED encodes condensate material properties and can alter cell physiology.
(A) Images are maximum z-projections of condensates formed by incubating 50nM of each CLN3 structure mutant with 1μΜ Whi3 for 5 hours at 25°C. Green corresponds to Whi3 and magenta corresponds to CLN3. Each channel is contrasted identically in all images. All scale bars throughout this figure correspond to 5μm. (B) The central regions of the largest 50 condensates from experiments corresponding to panel (A) are used to estimate dense phase fluorescence intensities for Whi3 and CLN3 (see Methods and Fig S13). Fluorescence intensities have been divided by 100. Error bars represent standard deviations. (C) The circularity is plotted against the area of each condensate from experiments corresponding to panel (A). (D) Images are maximum z-projections of Whi3-tdTomato in Ashbya strains with the indicated CLN3 structural mutants integrated into the genome. Each image is contrasted separately to aid visualization. (E) Images corresponding to the indicated times from time lapses of Whi3 in the L1 (top) and H1 (bottom) Ashbya strains are shown. Circular black regions of exclusion correspond to nuclei. Each image is a single z-slice, and each row is contrasted separately to aid visualization. (F) Hyphae in images from experiments corresponding to panel (D) were categorized as belonging to 1 of 3 categories: “big condensates” as shown in the L1 image in panel (D), “intermediate” as shown in the L2 and WT images in panel (D), or “network” as shown in the H1 and H2 images in panel (D). The total numbers of categorized hyphae for each CLN3 mutant Ashbya strain are L1 (75), L2 (30), WT (17), H1 (60), and H2 (18). (G) Spindle pole body and nuclei staining were performed on fixed Ashbya cells from which nuclear division states were determined (see Fig S15). The total numbers of categorized nuclei for each CLN3 mutant Ashbya strain are L1 (109), L2 (39), WT (61), H1 (150), and H2 (66). (H) Hyphal growth rates were measured for each of the indicated CLN3 mutant Ashbya strains. Black and white bars represent medians. The total numbers of measured hyphae are L1 (672), L2 (681), H1 (895), and H2 (675). All distributions are significantly based on the Mann-Whitney U test with p < 0.01, except for L2 and H1 which are different with p = 0.048.
Figure 4:
Figure 4:. RNA conformational heterogeneity has opposite effects on RNA clustering across the phase boundary.
(A) TIRF microscopy was used to visualize the first condensates formed as the phase boundary is crossed. The magenta channel corresponds to CLN3 and the green channel corresponds to Whi3. Scale bars correspond to 5μm. (B) Condensates in experiments corresponding to panel (A) are segmented, and their radii are plotted for each CLN3 structure mutant. Error bars represent 95% confidence intervals. (C) CLN3 fluorescence intensity distributions are plotted for segmented condensates. Black and white bars indicate medians. All distributions are significantly different based on the Mann-Whitney U test with p < 0.01.
Figure 5:
Figure 5:. RNA encodes physical properties via disparate free energy costs of conformational entropy penalties.
Synonymous mutations are designed and introduced to the WT mRNA to generate RNAs with polarized ensemble diversity. The low ensemble diversity RNA monomer samples a class of structures very similar to each other (top, green), which limits RNA-RNA interactions in the dense phase, but as a result, minimizes conformational entropy costs upon condensation. The high ensemble diversity RNA monomer samples a class of structures that greatly diverge from each other (bottom, purple), which lead to mesh-like RNA-RNA interactions in the dense phase and a high conformational entropy cost upon condensation.

Similar articles

References

    1. Vihinen M., When a Synonymous Variant Is Nonsynonymous. Genes 13, 1485 (2022). - PMC - PubMed
    1. Mauno V., Nonsynonymous Synonymous Variants Demand for a Paradigm Shift in Genetics. Current Genomics 24, 18–23 (2023). - PMC - PubMed
    1. Buhr F. et al., Synonymous Codons Direct Cotranslational Folding toward Different Protein Conformations. Molecular Cell 61, 341–351 (2016). - PMC - PubMed
    1. Walsh I. M., Bowman M. A., Soto Santarriaga I. F., Rodriguez A., Clark P. L., Synonymous codon substitutions perturb cotranslational protein folding in vivo and impair cell fitness. Proceedings of the National Academy of Sciences 117, 3528–3534 (2020). - PMC - PubMed
    1. Sanchez de Groot N. et al., RNA structure drives interaction with proteins. Nature Communications 10, 3246 (2019). - PMC - PubMed

Publication types

LinkOut - more resources