[Preprint]. 2024 Dec 12:2024.12.11.627894.
doi: 10.1101/2024.12.11.627894.

Deconstruction of a memory engram reveals distinct ensembles recruited at learning

Affiliations

Deconstruction of a memory engram reveals distinct ensembles recruited at learning

Clément Pouget et al. bioRxiv. .

Abstract

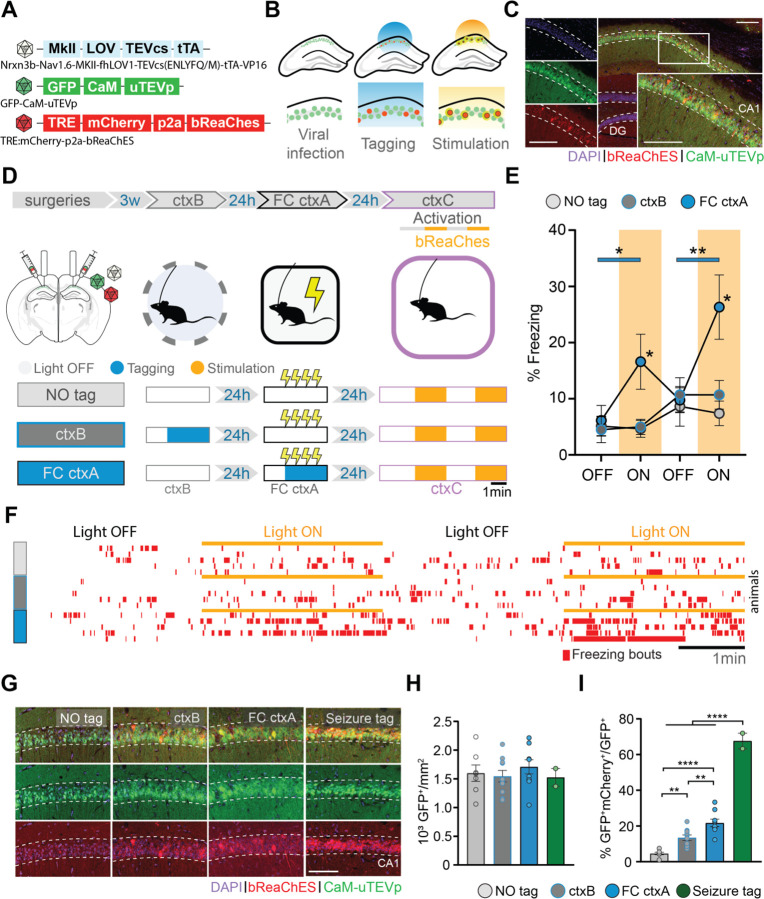
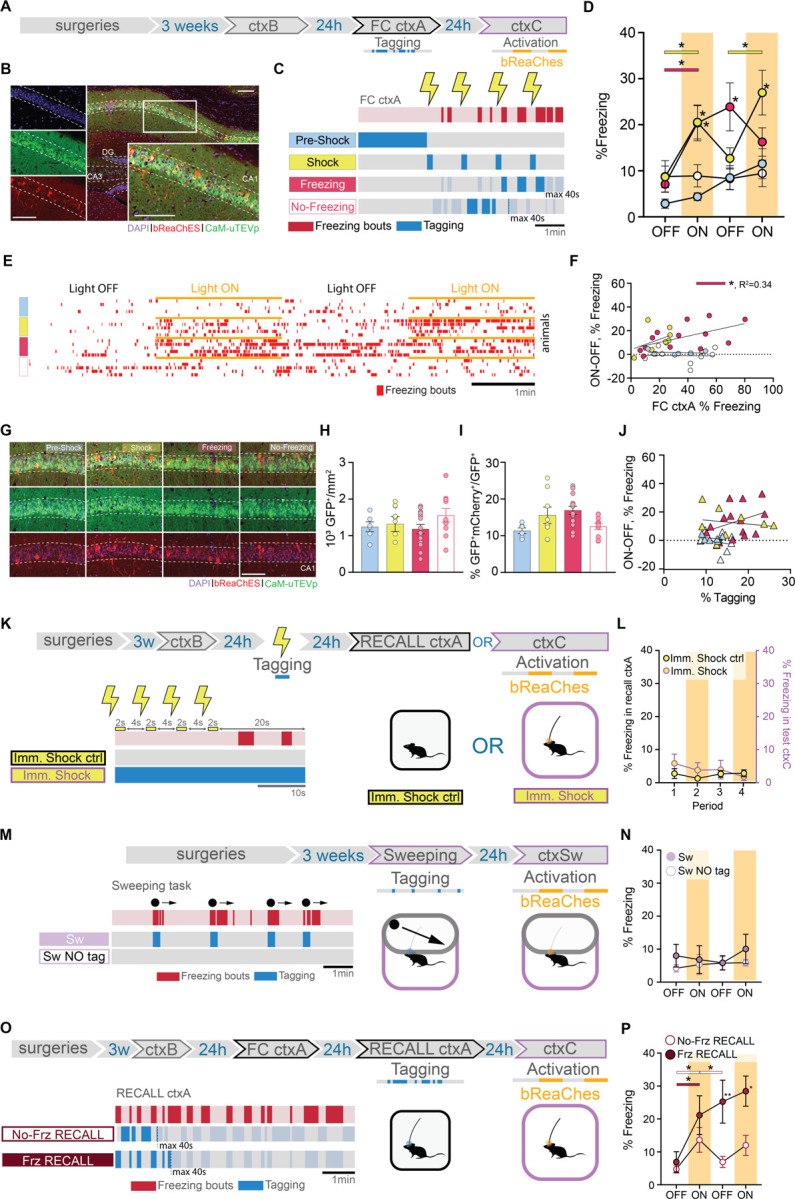
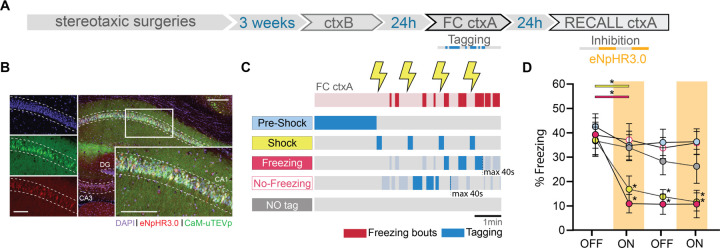
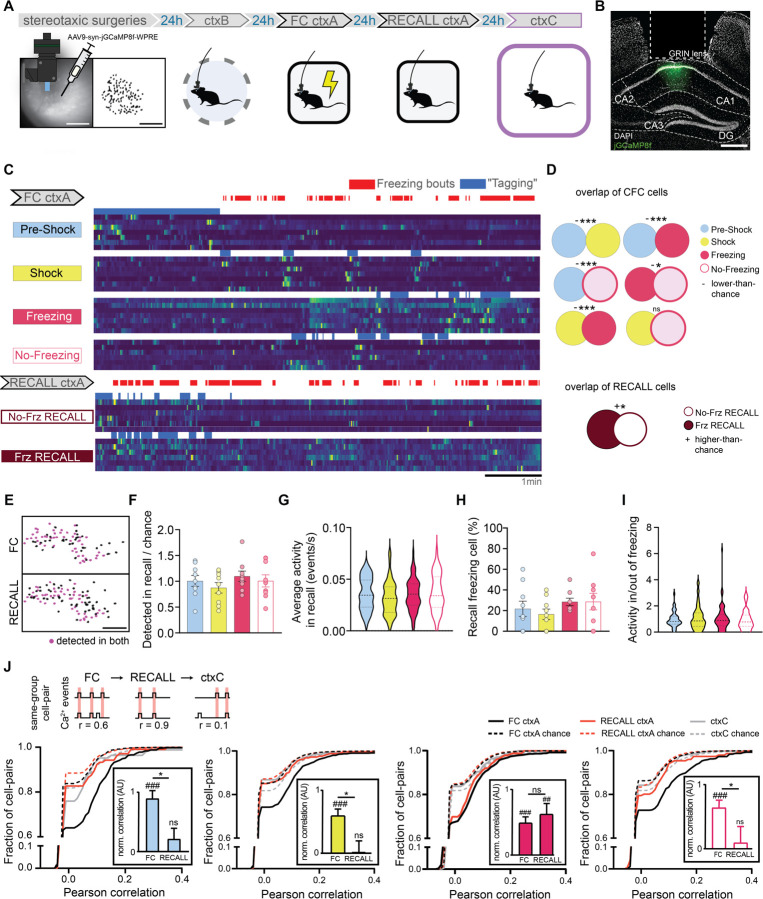
How are associative memories formed? Which cells represent a memory, and when are they engaged? By visualizing and tagging cells based on their calcium influx with unparalleled temporal precision, we identified non-overlapping dorsal CA1 neuronal ensembles that are differentially active during associative fear memory acquisition. We dissected the acquisition experience into periods during which salient stimuli were presented or certain mouse behaviors occurred and found that cells associated with specific acquisition periods are sufficient alone to drive memory expression and contribute to fear engram formation. This study delineated the different identities of the cell ensembles active during learning, and revealed, for the first time, which ones form the core engram and are essential for memory formation and recall.


Conflict of interest statement

Competing interests: Authors declare that they have no competing interests.

Figures

Fig. 1.
Fig. 1.. Optogenetic stimulation of f-FLiCRE-tagged dCA1 cells active during fear conditioning triggers memory recall.
(A) f-FLiCRE viral constructs with the excitatory opsin bReaChES are injected bilaterally in the dCA1. (B) Cells expressing f-FLiCRE (green) are tagged using blue light. Tagged cells (red) express mCherry and bReaChES. Later stimulation with yellow light activates previously tagged bReaChes cells. (C) Example histology of f-FLiCRE-bReaChES infected (GFP+, green) and tagged (mCherry+, red) cells (DAPI+, blue) in the dorsal hippocampus and magnification in CA1. Scale bar: 100µm. (D) Schematics of the experimental protocol (top). Tagging and reactivation timelines for the three groups: “NO tag”, “ctxB”, and “FC ctxA” (bottom). (E) Comparison of freezing levels between groups in ctxC during light-OFF (no shading) and light-ON epochs (yellow shading). (F) Freezing timelines of representative individual animals. (G) Representative images of infection (green) and tagging (red) in the three previously described groups, as well as of a “seizure tag” control. Scale bar: 100 µm. (H) Density of GFP+ (i.e. infected) neurons in the dCA1 layer. (I) Percentage of tagged cells (GFP+mCherry+/GFP+). Each data point corresponds to the mean value for each individual animal while bars represent mean ± SEM across animals. Statistical tests are ordinary one-way or RM two-way ANOVAs depending on the case. Statistical differences are depicted with asterisks, with color-coded lines used to show between-epoch comparisons, for consecutive periods only (non-consecutive significance is not shown). *p<0.05, **p<0.01, ****p<0.001.
Fig. 2.
Fig. 2.. dCA1 cells differentially integrate into the engram depending on when they are active during FC.
(A) Schematic of the experimental protocol: f-FLiCRE viral constructs with the excitatory opsin bReaChES are injected bilaterally into the dCA1; opto-tagging occurs during FC ctxA and opto-reactivation 24 hours later during ctxC. (B) Example histology of f-FLiCRE-bReaChES infected (GFP+, green) and tagged (mCherry+, red) cells (DAPI+, blue) in the dorsal hippocampus and magnification in CA1. Scale bar: 100µm. (C) Tagging strategy for “pre-shock”, “shock”, “freezing”, and “no-freezing” groups. (D) Comparison of freezing levels between groups in ctxC during light-OFF (no shading) and light-ON epochs (yellow shading). (E) Example individual freezing traces from the four different tagging groups. (F) Correlation between Δfreezing in ctxC and overall freezing in FC ctxA. (G) Representative images of infection (green) and tagging (red) in the four groups. Scale bar: 100 µm. (H) Density of GFP+ (i.e., infected) neurons in the dCA1 layer. (I) Percentage of tagged cells (GFP+mCherry+/GFP+). (J) Correlation between Δfreezing in ctxC and percentage of tagged cells. (K) Schematics of immediate shock protocols: opto-tagging occurs during presentation of immediate shocks; “Imm. Shock ctrl” animals are tested in a recall ctxA session, while “Imm. Shock” animals are opto-reactivated in ctxC. (L) Freezing level comparison for the two immediate shock groups. Left axis is freezing in recall ctxA for “Imm. Shock ctrl”, while the right axis is freezing in test ctxC for “Imm. Shock” animals. (M) Schematics of “Sw” and “Sw NO tag’’ protocol: opto-tagging occurs during sweeping episodes in a modified ctxC and opto-reactivation 24 hours later in the same context. (N) Freezing level comparison for the two sweeping groups. (O) Schematics of “No-Freez RECALL” and “Freez RECALL” groups: opto-tagging occurs during RECALL ctxA 24 hours after FC ctxA and opto-reactivation occurs during ctxC, another 24 hours later. (P) Freezing level comparison for the recall groups. Each data point corresponds to the mean value for each individual animal while bars represent mean ± SEM across animals. Statistical tests are ordinary one-way or RM two-way ANOVAs depending on the case. Statistical differences are depicted with asterisks, with color-coded lines used to show between-epoch comparisons, for consecutive periods only (non-consecutive significance is not shown). *p<0.05, **p<0.01.
Fig. 3.
Fig. 3.. dCA1 cells whose reactivation is sufficient for memory recall are also necessary for memory recall.
(A) Schematic of the experimental protocol: f-FLiCRE viral constructs with inhibitory opsin eNpHR3.0 are injected bilaterally in mouse dCA1; opto-tagging occurs during FC ctxA and opto-inhibition during recall ctxA 24 hours later. (B) Example histology of f-FLiCRE-eNpHR3.0 infected (GFP+, green channel) and tagged (mCherry+, red channel) cells (DAPI+, blue channel) in the dorsal hippocampus and magnification in CA1. Scale bar: 100µm. (C) Schematic of the tagging protocols for “pre-shock”, “shock”, “freezing”, “no-freezing” and “NO tag” inhibition. (D) Comparison of freezing levels between groups in recall ctxA during light-OFF (no shading) and light-ON epochs (inhibition, red shading). RM two-way ANOVA. Statistical differences are depicted with asterisks, with color-coded lines used to show between-epoch comparisons, for consecutive periods only (non-consecutive significance is not shown). *p<0.05.
Fig. 4.
Fig. 4.. In-vivo calcium imaging of FC ctxA tagged cells
(A) Schematic of the experimental protocol: jGCaMP8f is injected into dCA1, a relay lens is placed on top of it and a baseplate is installed to allow imaging using the miniscope. Five weeks later, dCA1 cells are imaged across three experiments. (B) Example histology of injection and lens placement. DAPI is in white, jGCaMP8f in green. Scale bar: 400 µm. (C) Example calcium traces from the four different FC ctxA f-FLiCRE-like cell groups, as well as the two RECALL ctxA ones. Blue represents the periods used to determine which cells belong to the corresponding group, and would have been tagged using f-FLiCRE. (D) Overlap between cell groups from the same experiment, top: FC, and bottom: RECALL. ‘+’ denotes higher-than-chance overlaps, ‘-’ lower than chance overlaps, ‘n.s.’ denotes no significant difference from chance. (E) Example cell tracking between two experiments using CellReg. Scale bar: 100 µm. (F) Number of cells per animal from FC ctxA cell groups detected in RECALL ctxA over chance number by cell group. (G) Average calcium events per second in RECALL ctxA for tracked cells by cell group. (H) Percentage of FC ctxA groups cells that are freezing cells in Test ctxA. (I) Activity ratios per animal of FC ctxA groups for cells inside/outside of RECALL ctxA freezing bouts. (J) Cumulative distributions of same-group cell-pair Pearson correlations in FC ctxA (black lines), RECALL ctxA (red lines) and ctxC (gray lines). Chance-level correlations are shown with dotted lines. Statistical tests are comparisons to bootstrapped distributions for overlaps, and ordinary one-way ANOVA otherwise. *p<0.05, ***p<0.001, ##p<0.01, ###p<0.001.

Similar articles

References

    1. Josselyn S. A. & Tonegawa S. Memory engrams: Recalling the past and imagining the future. Science 367, eaaw4325 (2020). - PMC - PubMed
    1. Maren S. NEUROBIOLOGY OF PAVLOVIAN FEAR CONDITIONING. Annu. Rev. Neurosci. 24, 897–931 (2001). - PubMed
    1. Liu X. et al. Optogenetic stimulation of a hippocampal engram activates fear memory recall. Nature 484, 381–385 (2012). - PMC - PubMed
    1. Ramirez S. et al. Creating a False Memory in the Hippocampus. Science 341, 387–391 (2013). - PubMed
    1. Tonegawa S., Liu X., Ramirez S. & Redondo R. Memory Engram Cells Have Come of Age. Neuron 87, 918–931 (2015). - PubMed

Publication types

LinkOut - more resources