[Preprint]. 2024 Dec 13:2024.12.11.627053.
doi: 10.1101/2024.12.11.627053.

An endogenous cluster of target-directed microRNA degradation sites induces decay of distinct microRNA families

Affiliations

An endogenous cluster of target-directed microRNA degradation sites induces decay of distinct microRNA families

Nicholas M Hiers et al. bioRxiv. .

Abstract

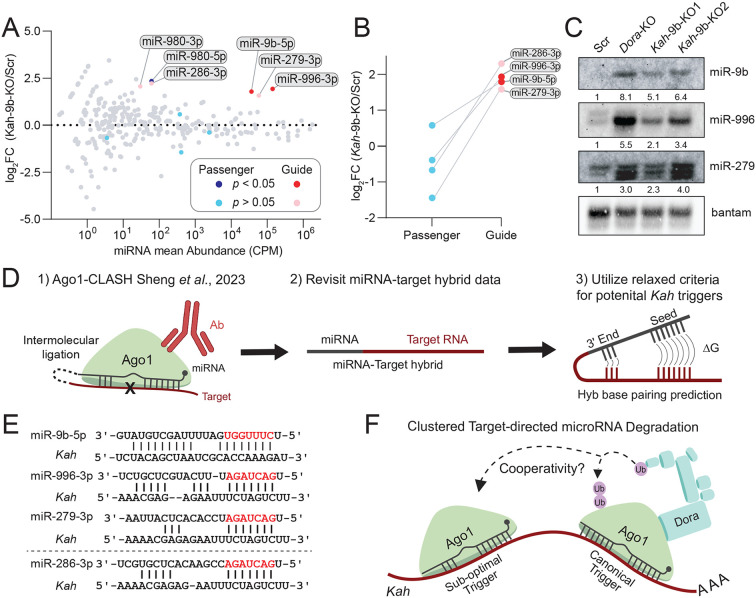
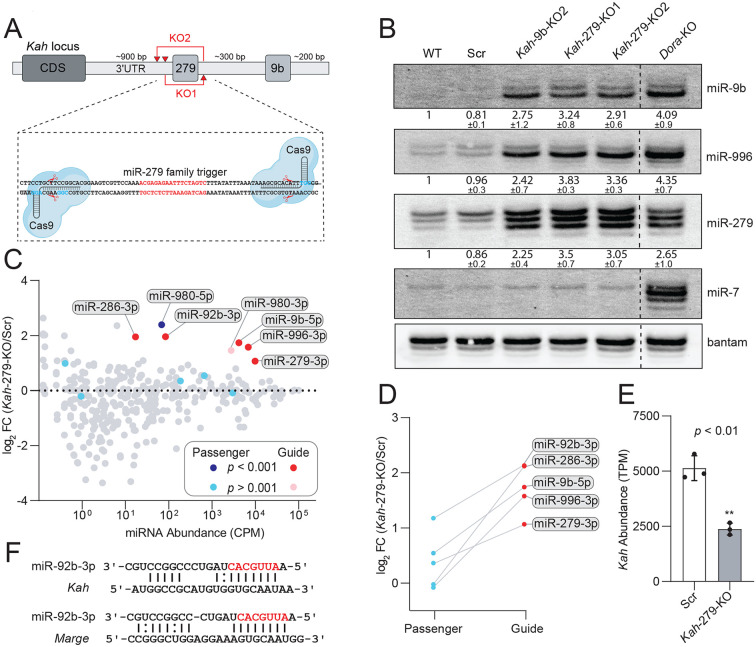
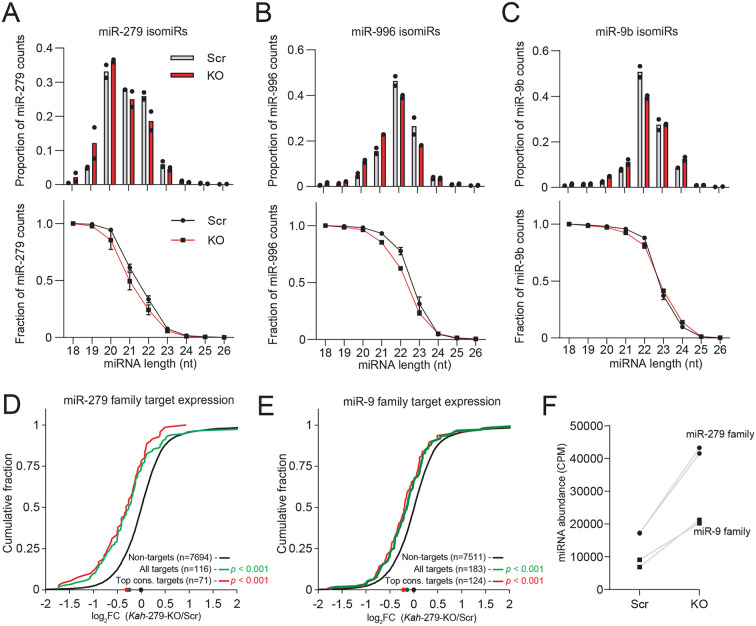
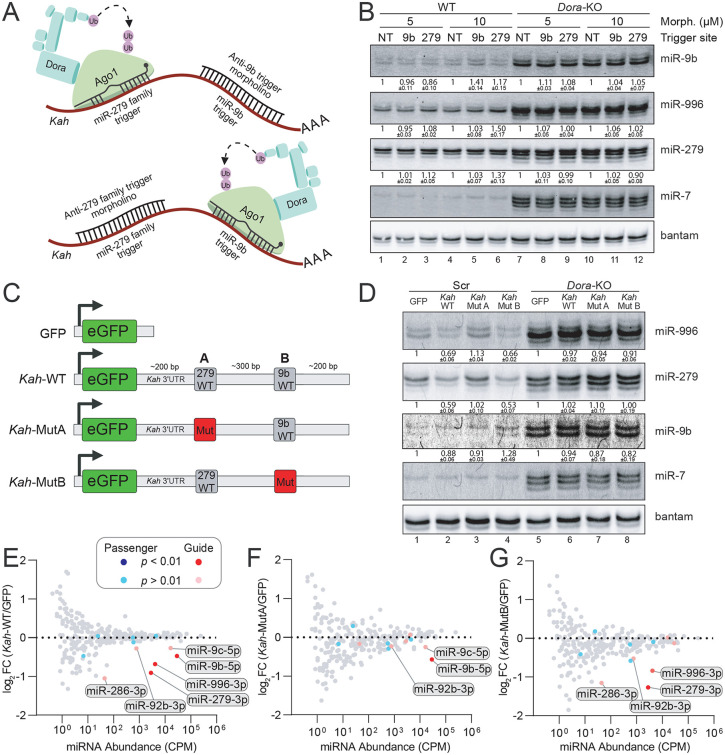
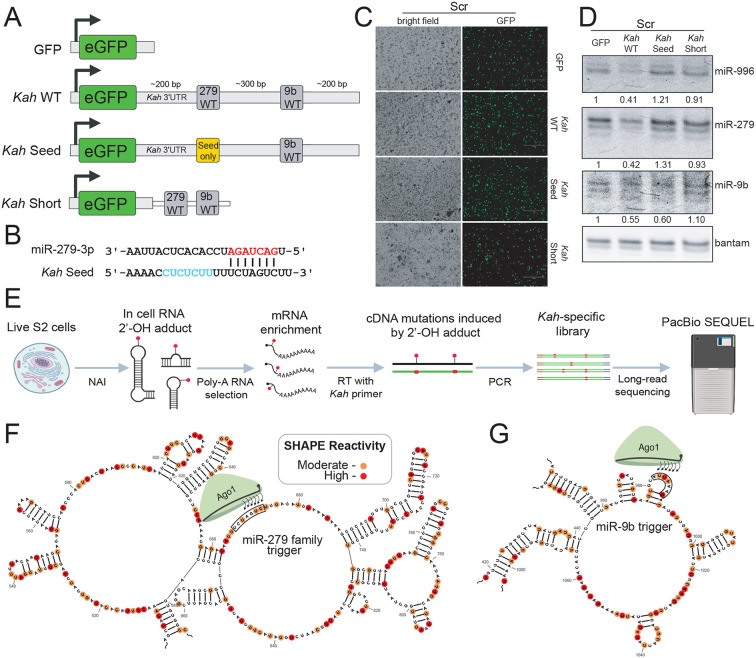
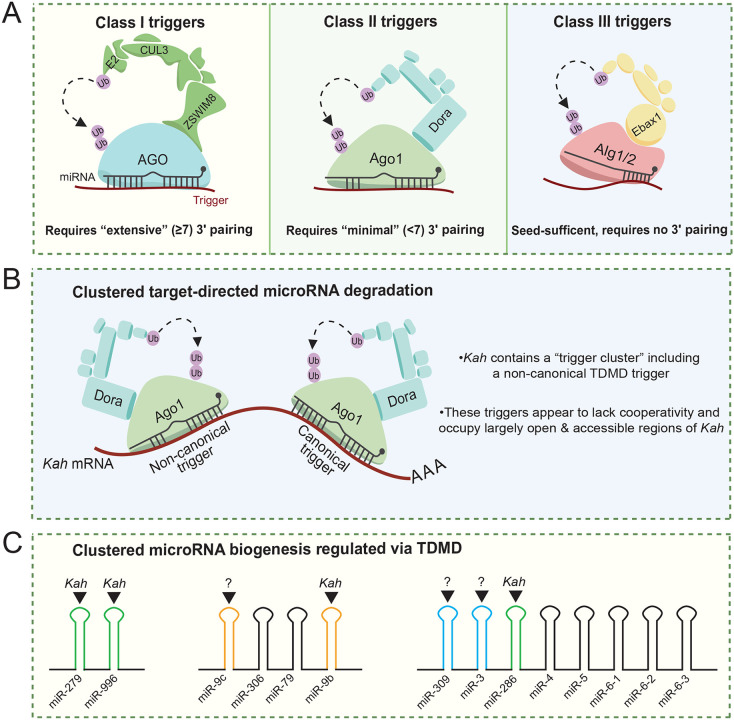
While much is known about miRNA biogenesis and canonical miRNA targeting, relatively less is understood about miRNA decay. The major miRNA decay pathway in metazoans is mediated through target-directed miRNA degradation (TDMD), in which certain RNAs can "trigger" miRNA decay. All known triggers for TDMD base pair with the miRNA seed, and extensively base pair on the miRNA 3' end, a pattern that supposedly induces a TDMD-competent conformational change of Argonaute (Ago), allowing for miRNA turnover. Here, we utilized Ago1-CLASH to find that the Drosophila transcript Kah contains at least two triggers, a "trigger cluster", against miR-9b and the miR-279 family. One of these triggers contains minimal/non-canonical 3' end base pairing but is still sufficient to induce TDMD of the entire miR-279 family. We found that these clustered triggers likely lack cooperativity, the minimal 3' pairing is required for miR-279 family turnover, and probed the in-cell RNA structure of the Kah trigger cluster. Overall, this study expands the list of endogenous triggers and the unexpectedly complex regulatory network governing miRNA degradation.

Keywords: AGO-CLASH; SHAPE; TDMD; microRNA.


Figures

Figure 1.
Figure 1.. Ago1-CLASH suggests a cluster of TDMD triggers in Kah.
(A) The impact of Kah-9b trigger knockout on miRNA abundance as determined by small RNA-seq reported in Sheng et al., 2023. miRNA abundance (x-axis) represents the mean counts between Scr and Kah-9b KO libraries, the y-axis represents the change in abundance following trigger KO in log2 fold-change (log2FC). Each dot represents an individual miRNA. Upregulated guide strands are marked in red (significant) and pink (not significant), with the passenger strands of these miRNAs being highlighted in navy blue (significant) and cyan (not significant). P-values were calculated using DEseq2. An FDR-adjusted p-value <0.05 was used as the significance threshold for this analysis (n=2 biological replicates). (B) A comparison of the log2FC between miRNA guide and passenger strands following loss of Kah-9b trigger. (C) Northern blot validating miRNA change in abundance following Kah-9b trigger KO. Lane labels correspond to S2 cell lines: WT (wild type), Scr (scramble/non-target sgRNA control), Kah trigger KO, and Dora KO. The bantam miRNA was used as a loading control as it is not sensitive to TDMD. (D) Reutilization of the Ago1-CLASH dataset reported in Sheng et al., 2023. All miRNA-target hybrids for the miR-279 family were considered when screening for potential non-canonical Kah triggers. (E) A summary of the Kah triggers for miR-9b, 279, and 996 found using Ago1-CLASH. miR-286 did not form hybrids with Kah and was therefore separated from the others by the dashed line. Red letters indicated the miRNA seed region. CLASH-identified hybrids used the Hyb base pairing pipeline to predict the most stable miRNA-trigger base pairing conformation, whereas miR-286:Kah base pairs were predicted using RNAcofold. (F) A representative model of a clustered TDMD cooperativity model, where a canonical trigger such as Kah-9b may nucleate the transcript for TDMD of coupled sub-optimal triggers, such as the Kah-279 trigger. Lavender circles represent ubiquitin and unlabeled boxes in the Dora complex represent currently unknown Culin-RING E3 ubiquitin ligase components.
Figure 2.
Figure 2.. The Kah transcript regulates the abundance of distinct miRNA families.
(A) A schematic of CRISPR-Cas9 targeted deletion of the Kah-279 trigger within the Kah genomic locus. Red triangles represent predicted sites of Cas9-mediated cleavage (top). The Kah-279 trigger sequence is highlighted in red (bottom) with the PAM sequences adjacent to each sgRNA target site highlighted in cyan. (B) Northern blot validating miRNA change in abundance following Kah-279 trigger KO. Relative miRNA levels are shown as mean ± standard deviation (SD) (n=3 biological replicates). miR-7 serves as a positive control for Dora sensitivity. (C) AQ-seq detection of miRNA changes in abundance following Kah-279 trigger KO. miRNA abundance (x-axis) represents the mean miRNA counts per million (CPM) in Scr libraries. Highlighted are miRNAs upregulated following Kah-279 KO, an FDR-adjusted p-value <0.001 was used as the significance threshold for this analysis (n=2 biological replicates). (D) A comparison of the log2FC between miRNA guide and passenger strands following loss of Kah-279 trigger. (E) The influence of Kah-279 trigger KO on Kah transcript abundance as determined by RNA-seq in transcripts per million (TPM). P-values were calculated using DEseq2. ** represents a p-value < 0.01. (F) A potential miR-92b trigger within Kah identified via Ago1-CLASH, compared to the previously reported Marge:miR-92b interaction.
Figure 3.
Figure 3.. The Kah trigger cluster differentially influences miRNA tailing, trimming, and function.
The relative proportion (top) or fraction (bottom) of isomiRs separated by length from 18-26 nts. Individual replicate values are marked with black dots (top) or an error bar (bottom). Grey and red bars represent the mean abundance in Scr and Kah-279 KO, respectively for (A) miR-279, (B) miR-996, or (C) miR-9b. The increased repression of the predicted targets of the (D) miR-279 family and (E) miR-9 family following loss of the Kah-279 trigger. Plotted is the cumulative change (log2FC) in TargetScan predicted mRNA target abundance following Kah-279 trigger KO compared to Scr control. The log2FC of individual transcripts between conditions was calculated using DEseq2. Targets were classified into all conserved targets, top conserved targets, or all other targets (non-targets) with the number of transcripts considered for each cohort listed within the plot. Dots at the bottom of the graphs represent the median expression level of each target cohort. P-values were calculated using the Mann-Whitney U test, n=3 biological replicates. (F) The change in miRNA family (miR-279 or miR-9) abundance following Kah-279 trigger KO. Individual replicates are listed as black dots (miR-279 family) or black squares (miR-9 family), n=2 biological replicates.
Figure 4.
Figure 4.. The Kah trigger cluster specifies miRNA decay with little crosstalk.
(A) A schematic of anti-trigger morpholino experimental design for endogenous Kah. (B) Northern blot reporting the miRNA change in abundance following incubation with either non-target (NT), anti-9b trigger (9b), or anti-279 trigger (279) morpholinos at either 5 or 10 μM. Relative miRNA levels are shown as mean ± SD (n=3 biological replicates). (C) A schematic of our GFP reporter systems as described in the main text: GFP, Kah-WT, Kah-MutA, and Kah-MutB. (D) Northern blot reporting the miRNA change in abundance following introduction of reporters shown in (C). Relative miRNA levels are shown as mean ± SD (n=3 biological replicates). AQ-seq describing miRNA change in abundance following expression of (E) Kah-WT, (F) Kah-MutA, or (G) Kah-MutB compared to the GFP control. miRNA abundance (x-axis) represents the mean miRNA counts per million (CPM) in GFP libraries. Highlighted are miRNAs downregulated following reporter expression, an FDR-adjusted p-value <0.01 was used as the significance threshold for this analysis (n=2 biological replicates).
Figure 5.
Figure 5.. Structural and functional insights into the Kah trigger cluster.
(A) A schematic of our GFP reporter system as described in the main text: GFP, Kah-WT, Kah-Seed, and Kah-Short. (B) A schematic of the predicted base pairing of the Kah-Seed reporter with miR-279. Red letters indicate the miRNA seed region, cyan letters indicate mutated bases. Base pairs were predicted using RNAcofold. (C) The transfection efficiency of the Scr cell line with each GFP reporter described in (A) captured with fluorescence microscopy. Scale bars indicate 300 μm. (D) Northern blot reporting the miRNA change in abundance following introduction of GFP reporters described in (A). Relative miRNA levels are shown as mean miRNA signal. (E) A schematic of Kah SHAPE library construction for long-read PacBio sequencing. (F) The local consensus secondary structure of the Kah-279, or (G) Kah-9b trigger as predicted via SHAPEmapper2. Highly reactive nucleotides are highlighted in red, with moderately reactive nucleotides highlighted in orange. Black boxes mark the seed-binding regions of either trigger.
Figure 6.
Figure 6.. Proposed TDMD trigger classifications and clustered TDMD.
(A) A schematic of proposed trigger classifications: Class I triggers – require “canonical” extensive 3′ complementarity, a representative image of the mammalian TDMD complex is shown since all known mammalian triggers currently belong to this classification. Class II triggers – require “minimal” 3′ complementarity, a representative image of the Drosophila TDMD complex is shown since Kah-279 fits this classification. Class III triggers – are “seed-sufficient” in that they require no 3′ complementarity, a representative image of the C. elegans TDMD complex is shown since the miR-35 family trigger is hypothesized to fit this classification. (B) A summary of the findings from this study: the non-canonical/Class II trigger Kah-279, clustered target-directed miRNA degradation, and a structural role for trigger 3′ complementarity. (C) A summary of the pri-miRNA transcripts regulated via Kah. Included are pri-miR-279~996, pri-miR-9c~9b, and pri-miR-309~6-3. miRNAs reported to be sensitive to TDMD are indicated with black triangles above their hairpins with corresponding triggers indicated. The miR-279 family is highlighted in green, the miR-9 family in orange, and the miR-3 family in cyan.

Similar articles

References

    1. Bartel D.P. (2018). Metazoan MicroRNAs. Cell 173, 20–51. 10.1016/j.cell.2018.03.006. - DOI - PMC - PubMed
    1. Lee R.C., Feinbaum R.L., and Ambrost V. (1993). The C. elegans Heterochronic Gene lin-4 Encodes Small RNAs with Antisense Complementarity to lin-14. Cell 75, 843–854. 10.1016/0092-8674(93)90529-y - DOI - PubMed
    1. Wightman B., Ha L., and Ruvkun G. (1993). Posttranscriptional Regulation of the Heterochronic Gene lin-14 by W-4 Mediates Temporal Pattern Formation in C. elegans. Cell 75, 855–862. 10.1016/0092-8674(93)90530-4 - DOI - PubMed
    1. Friedman R.C., Farh K.K.H., Burge C.B., and Bartel D.P. (2009). Most mammalian mRNAs are conserved targets of microRNAs. Genome Res 19, 92–105. 10.1101/gr.082701.108. - DOI - PMC - PubMed
    1. Agarwal V., Bell G.W., Nam J.-W., and Bartel D.P. (2015). Predicting effective microRNA target sites in mammalian mRNAs. Elife 4, e05005. 10.7554/eLife.05005. - DOI - PMC - PubMed

Publication types

LinkOut - more resources