[Preprint]. 2024 Dec 12:2024.12.09.627454.
doi: 10.1101/2024.12.09.627454.

Mitochondrial DNA mutations in human oocytes undergo frequency-dependent selection but do not increase with age

Affiliations

Mitochondrial DNA mutations in human oocytes undergo frequency-dependent selection but do not increase with age

Barbara Arbeithuber et al. bioRxiv. .

Abstract

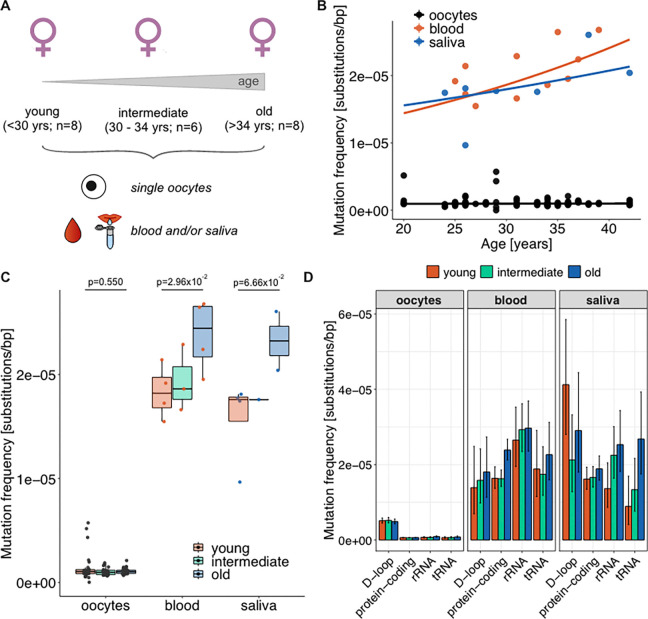
Mitochondria, cellular powerhouses, harbor DNA (mtDNA) inherited from the mothers. MtDNA mutations can cause diseases, yet whether they increase with age in human germline cells-oocytes-remains understudied. Here, using highly accurate duplex sequencing of full-length mtDNA, we detected de novo mutations in single oocytes, blood, and saliva in women between 20 and 42 years of age. We found that, with age, mutations increased in blood and saliva but not in oocytes. In oocytes, mutations with high allele frequencies (≥1%) were less prevalent in coding than non-coding regions, whereas mutations with low allele frequencies (<1%) were more uniformly distributed along mtDNA, suggesting frequency-dependent purifying selection. In somatic tissues, mutations caused elevated amino acid changes in protein-coding regions, suggesting positive or destructive selection. Thus, mtDNA in human oocytes is protected against accumulation of mutations having functional consequences and with aging. These findings are particularly timely as humans tend to reproduce later in life.


Conflict of interest statement

Declaration of interests The authors declare no competing interests.

Figures

Fig. 1.
Fig. 1.
MtDNA mutation frequencies in oocytes, blood, and saliva. (A) Oocytes, blood, and saliva samples were sequenced from 20–42 year-old women, assigned to three age groups: young, intermediate, and old. (B) Mixed-effects linear model analyzing the effect of age on mutation frequencies. Curves show the predicted mutation frequency based on the fixed-effect part of the model. Dots are the observed mutation frequencies per individual oocyte for oocytes, and per tissue per donor for somatic tissues. (C) Mutation frequencies measured in single oocytes, blood, and saliva are shown for each donor and each age group. P-values are from a permutation test comparing young and old age groups (one-sided test based on medians; 10,000 permutations; corrected for multiple testing; see Methods). (D) Tissue-specific mutation frequencies (i.e., the total number of tissue-specific mutations divided by the product of mtDNA region length and average DCS depth) for each age group in the D-loop (1,122 bp), protein-coding regions (11,341 bp), rRNA (2,513 bp), and tRNA (1,505 bp). Mutation frequencies for non-coding sequences outside of the D-loop (88 bp) are shown in Table S6. Mutation frequency bars are shown with 95% Poisson confidence intervals.
Fig. 2.
Fig. 2.
Analysis of variant hotspots. (A) The observed and expected distributions of the number of women sharing individual variants in oocytes (with all oocytes from a donor considered together) and somatic tissues. Due to similar mutation frequencies and lower numbers of measured mutations, blood and saliva were considered together as somatic tissues. We also considered the number of sequenced oocytes per donor to evaluate oocyte variant hotspots. For oocytes and somatic tissues separately, we computed the expected number of mutations present in exactly one woman and shared by several women. Our results suggest that, due to random chance, mutations at the same site can occur in two women, but are rarely expected to occur in somatic tissues of three or more women, and in oocytes of four or more women. (B) Distribution of mutations (normalized by the length of the respective region) among D-loop, intergenic regions (i.e. non-coding DNA outside of the D-loop), protein-coding regions, rRNA, and tRNA, shown separately for each tissue and hotspots vs. non-hotspots. Numbers indicate the total number of mutations analyzed. The proportion of mtDNA occupied by each region is shown on the right.
Fig. 3.
Fig. 3.
Evaluation of selection in heteroplasmic transmissions. (A) MAF difference between oocytes and somatic tissues measured in percentage points; a positive (negative) shift represents a higher (lower) MAF of a heteroplasmy in oocytes compared to somatic tissues for a given a woman. (B) Number of heteroplasmies showing an increased or decreased MAF in oocytes (positive or negative shift, respectively), shown separately for mtDNA regions, and either combined or separated by age group. Left-pointing arrows indicate higher numbers of negative versus positive shifts. *p<0.05, **p<0.01, ***p< 0.001, and ****p<0.0001; binomial test, corrected for multiple testing using the method of Benjamini-Hochberg to control the false discovery rate. (C) Log2 ratio of MAF difference between oocytes and somatic tissues, calculated to take into account the magnitude of the fold-change in MAFs . 109 transmissions with MAF=0 in an oocyte are not displayed due to the resulting negative infinite values. Colors indicate their localization in different mtDNA regions, and shapes show the age group of a woman.
Figure 4.
Figure 4.. Proportions of mtDNA variants in oocytes depending on their frequency, heritability, and age group.
Distribution of mutations (normalized by the length of the respective region) among D-loop, intergenic DNA, protein-coding regions, rRNA, and tRNA, shown separately for de novo mutations with MAF <1%, denovo mutations with high-confidence MAF≥1% (measured in ≥3 DCS to ensure proper representation on MAFs; 10 mutations measured in <3 DCS were excluded), and inheritable heteroplasmies. Numbers on the left represent the total number of mutations analyzed, or the number of base pairs annotated in each region for the mtDNA reference.

Similar articles

References

    1. Suomalainen A., and Nunnari J. (2024). Mitochondria at the crossroads of health and disease. Cell 187, 2601–2627. 10.1016/j.cell.2024.04.037. - DOI - PubMed
    1. Taylor R.W., and Turnbull D.M. (2005). Mitochondrial DNA mutations in human disease. Nat. Rev. Genet. 6, 389–402. 10.1038/nrg1606. - DOI - PMC - PubMed
    1. Dabravolski S.A., Khotina V.A., Sukhorukov V.N., Kalmykov V.A., Mikhaleva L.M., and Orekhov A.N. (2022). The Role of Mitochondrial DNA Mutations in Cardiovascular Diseases. Int. J. Mol. Sci. 23. 10.3390/ijms23020952. - DOI - PMC - PubMed
    1. Gorman G.S., Schaefer A.M., Ng Y., Gomez N., Blakely E.L., Alston C.L., Feeney C., Horvath R., Yu-Wai-Man P., Chinnery P.F., et al. (2015). Prevalence of nuclear and mitochondrial DNA mutations related to adult mitochondrial disease. Ann. Neurol. 77, 753–759. 10.1002/ana.24362. - DOI - PMC - PubMed
    1. Pakendorf B., and Stoneking M. (2005). Mitochondrial DNA and human evolution. Annu. Rev. Genomics Hum. Genet. 6, 165–183. 10.1146/annurev.genom.6.080604.162249. - DOI - PubMed

Publication types

LinkOut - more resources