[Preprint]. 2024 Dec 17:2024.12.12.627356.
doi: 10.1101/2024.12.12.627356.

Inferring gene-pathway associations from consolidated transcriptome datasets: an interactive gene network explorer for Tetrahymena thermophila

Affiliations

Inferring gene-pathway associations from consolidated transcriptome datasets: an interactive gene network explorer for Tetrahymena thermophila

Michael A Bertagna et al. bioRxiv. .

Update in

Abstract

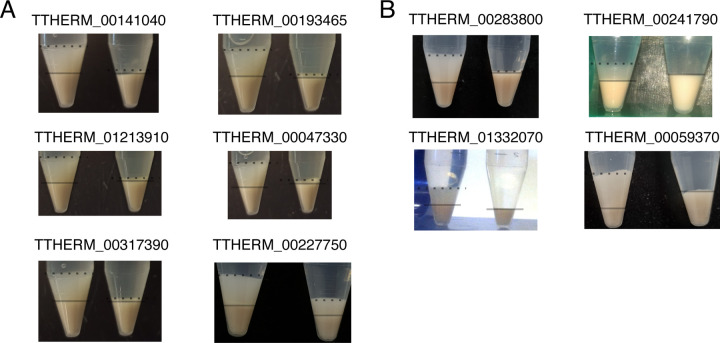
Although an established model organism, Tetrahymena thermophila remains comparatively inaccessible to high throughput screens, and alternative bioinformatic approaches still rely on unconnected datasets and outdated algorithms. Here, we report a new approach to consolidating RNA-seq and microarray data based on a systematic exploration of parameters and computational controls, enabling us to infer functional gene associations from their co-expression patterns. To illustrate the power of this approach, we took advantage of new data regarding a previously studied pathway, the biogenesis of a secretory organelle called the mucocyst. Our untargeted clustering approach recovered over 80% of the genes that were previously verified to play a role in mucocyst biogenesis. Furthermore, we tested four new genes that we predicted to be mucocyst-associated based on their co-expression and found that knocking out each of them results in mucocyst secretion defects. We also found that our approach succeeds in clustering genes associated with several other cellular pathways that we evaluated based on prior literature. We present the Tetrahymena Gene Network Explorer (TGNE) as an interactive tool for genetic hypothesis generation and functional annotation in this organism and as a framework for building similar tools for other systems.


Figures

Figure 1
Figure 1
Optimal parameterization significance testing for each dataset/normalization scheme and illustrations of optimal experimental partitions. Histograms illustrating modularity distributions for computational negative control (NC) partitions compared to the experimental partition created from the optimal parameterization. The computational negative controls based on scrambled data are in black, the computational negative controls based on a simulated hypercube with uniform data distribution are in purple, and the modularity value for the optimized partitions are indicated by the dashed green line. (A) The computational negative control comparison for the min-max normalized microarray dataset. (B) The computational negative control comparison for the min-max normalized RNA-seq dataset. (C) The computational negative control comparison for the z-score normalized microarray dataset. (D) The computational negative control comparison for the z-score normalized RNA-seq dataset. In each case, the modularity for the optimized clustering of the real data was statistically significantly greater than in either negative control (p < 0.005). Heatmaps illustrating the optimal partitions generated from (E) the min-max normalized microarray dataset, (F) the min-max normalized RNA-seq, (G), the z-score normalized microarray, and (H) the z-score normalized RNA-seq datasets. Modules of gene expression profiles are ordered by hierarchical clustering of the module centroids using average linkage. Each row of a given heat map corresponds to one gene’s expression. In (E) and (G), the x-axis denotes the different phases of the T. thermophila life cycle: low density logarithmic growth (Ll), medium density logarithmic growth (Lm), high density logarithmic growth (Lh), 0–24 hours of starvation (S0-S24), and 0–18 hours of conjugation (C0-C18) (12). In (F) and (H), the x-axis denotes the stages of the mitotic cell cycle and corresponding timepoints for sampling.
Figure 2
Figure 2
Enrichment, differential expression, and overlap of experimentally validated mucocyst-associated and differentially expressed, upregulated genes. Min-max normalized expression profiles for genes in (A) the six microarray and (B) the four RNA-seq clusters significantly enriched for experimentally validated mucocyst-associated genes as well as the 33 genes overlapping between the upregulated, enriched microarray clusters, and enriched RNA-seq clusters in (C) the microarray and (D) the RNA-seq datasets. (E) Volcano plot illustrating differential expression of each gene represented in the microarray dataset over one hour in the MN173 mutant relative to the wild type T. thermophila. Thresholds are represented by blue dashed lines (q < 0.01 and fold-change > 1.5). All genes that passed the thresholds have a Bayesian posterior probability of differential expression greater than 80%. (F) Venn diagram describing the overlapping genes in the enriched microarray clusters, enriched RNA-seq clusters, and the set of upregulated genes with min-max normalization. Min-max normalized expression profiles for genes that are co-expressed in the microarray and RNA-seq datasets, but not detected in the upregulated dataset: (G) gene expression in the microarray profiles and (H) gene expression in the RNA-seq profiles.
Figure 3.
Figure 3.
Experimental validation of ten genes that are suggested to be mucocyst-associated by our co-expression analysis. (A) Genes that co-immunoprecipitated as members of the Mucocyst Docking and Discharge protein complex (TTHERM_00141040, TTHERM_00193465, TTHERM_01213910, TTHERM_00047330, TTHERM_00317390, and TTHERM_00227750) (5). (B) Four genes that were knocked out solely on the basis of our co-expression inference (TTHERM_00283800, TTHERM_00241790, TTHERM_01332070, and TTHERM_00059370). For each gene, the left tube shows the wildtype response to dibucaine as evidenced by a flocculent layer of mucus overlying the cell pellet after centrifugation. The boundary of the cell pellet is denoted by the solid line, and the boundary of the mucus layer is denoted by the dotted line. The right tube in each panel displays the phenotype of strains with the respective genes genetically knocked out. Each has a defect in mucocyst release in response to the dibucaine treatment.
Figure 4
Figure 4
Min-max normalized expression profiles of clusters significantly enriched for (A-B) histone, (C-D) ribosome, and (E-F) proteasome functional annotation terms in the microarray (left column) and RNA-seq (right column) analyses. In each case, the same number of clusters come up in the two datasets: one for histone-associated profiles, two for ribosome-associated profiles, and three for proteasome-associated profiles. The histone-associated profiles are characterized by low expression during starvation and high expression during growth and conjugation (A) and high expression during the S-phase of the cell cycle (B). Ribosome-associated profiles are characterized by high expression during growth or starvation and low expression during conjugation (C). In the RNA-seq expression dataset, the ribosome-associated profiles appear to be at a minimum during the first G1 phase and at a maximum at the second G1 phase, indicating that in this experiment they are not following the cyclicity of the mitotic cell cycle (D). The main characteristics of the proteasome-associated co-expression pattern are a sharp loss of expression at the beginning of conjugation (E) and a peak of expression during mitotic division (F).
Figure 5.
Figure 5.
A labeled diagram of the TGNE dashboard showing the min-max normalized data for the gene module enriched for histone-associated genes. (A) The “Conditions Selection Tabs” are exclusive to the microarray dashboard and allow the user to specify which life cycle phases are included within the input data to the clustering pipeline: the entire profile, just the vegetative conditions, or just the conjugative conditions. The “Normalization Selection Tabs” allow the user to select which normalization technique should be used on the input data: z-score or min-max. (B) The search bars are text fields that can be used to select genes based on their annotations. The left search bar allows searches for TTHERM_ID, common names, descriptions, and module number. The right search bar allows searches for functional annotation terms or codes, specifically: PFAM names or GO/KEGG/InterPro/E.C. alphanumeric codes. Here, “m179” was used as the search term to select the entire module that is enriched for histone-associated functional terms. (C) The heatmap representation of the normalized expression of all genes across all conditions, as in Figure 2E. The selected module is highlighted, and the unselected genes are grayed out. (D) This plot shows all modules with significantly enriched functional terms, which are the same terms as those that can be searched using the right-hand search bar. As with the heatmap, when a certain module is selected, the others are grayed out. Moving the cursor over any of the circles in the plot displays the enriched term, its fold-change relative to the genome background, and the Bonferroni-corrected p-value. Here, the indicated circle represents the InterPro term “IPR009072”, which corresponds to “Histone-fold”. This term is 386 times over-represented in this cluster relative to the genome background, with a Bonferroni-corrected p-value of ~4 × 10⁻¹¹. (E) An interactive UMAP representation of the gene expression with one tab showing the UMAP embedding of each cluster and the other tab showing the UMAP embedding of each gene. Selected genes and modules are highlighted, while unselected ones are grayed out. Clicking on any circle or selecting them with one of the tools to the right of the plot selects those module(s) or gene(s) for display. (F) The graph for displaying the expression profiles of the selected genes. This is an equivalent representation of the data in the heatmap. (G) The annotation table. When genes are selected, their annotation information based on the published T. thermophila genome, eggNOG, and InterProScan is populated into this table. Columns after the EC terms are not displayed in this figure. (H) The download buttons. The annotation table and functional enrichment information for the selected genes/modules can be downloaded as tab-separated files using these two buttons.

Similar articles

References

    1. Eisen M.B., Spellman P.T., Brown P.O. and Botstein D. (1998) Cluster analysis and display of genome-wide expression patterns. Proceedings of the National Academy of Sciences, 95, 14863–14868. - PMC - PubMed
    1. Lowe R., Shirley N., Bleackley M., Dolan S. and Shafee T. (2017) Transcriptomics technologies. PLOS Computational Biology, 13, e1005457. - PMC - PubMed
    1. Ruehle M.D., Orias E. and Pearson C.G. (2016) Tetrahymena as a unicellular model eukaryote: genetic and genomic tools. Genetics, 203, 649–665. - PMC - PubMed
    1. Jiang C., Gu S., Pan T., Wang X., Qin W., Wang G., Gao X., Zhang J., Chen K., Warren A., et al. (2024) Dynamics and timing of diversification events of ciliated eukaryotes from a large phylogenomic perspective. Molecular Phylogenetics and Evolution, 197, 108110. - PubMed
    1. Kuppannan A., Jiang Y.-Y., Maier W., Liu C., Lang C.F., Cheng C.-Y., Field M.C., Zhao M., Zoltner M. and Turkewitz A.P. (2022) A novel membrane complex is required for docking and regulated exocytosis of lysosome-related organelles in Tetrahymena thermophila. PLOS Genetics, 18, e1010194. - PMC - PubMed

Publication types

LinkOut - more resources