[Preprint]. 2025 Jan 28:2024.09.23.614468.
doi: 10.1101/2024.09.23.614468.

Caveolin-1 regulates context-dependent signaling and survival in Ewing sarcoma

Affiliations

Caveolin-1 regulates context-dependent signaling and survival in Ewing sarcoma

Dagan Segal et al. bioRxiv. .

Abstract

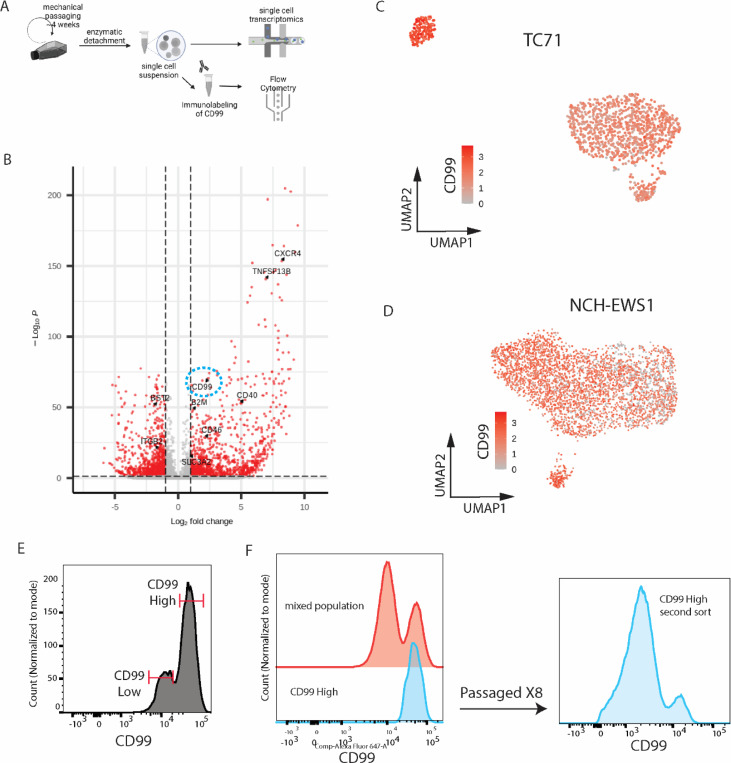
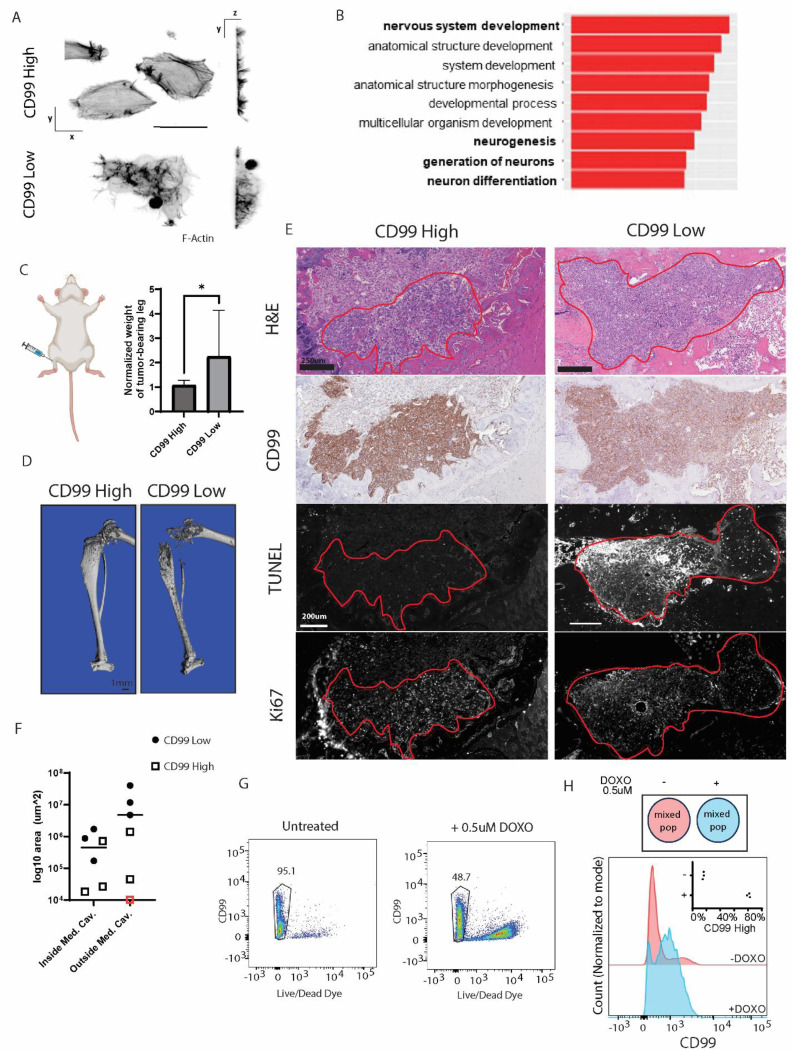
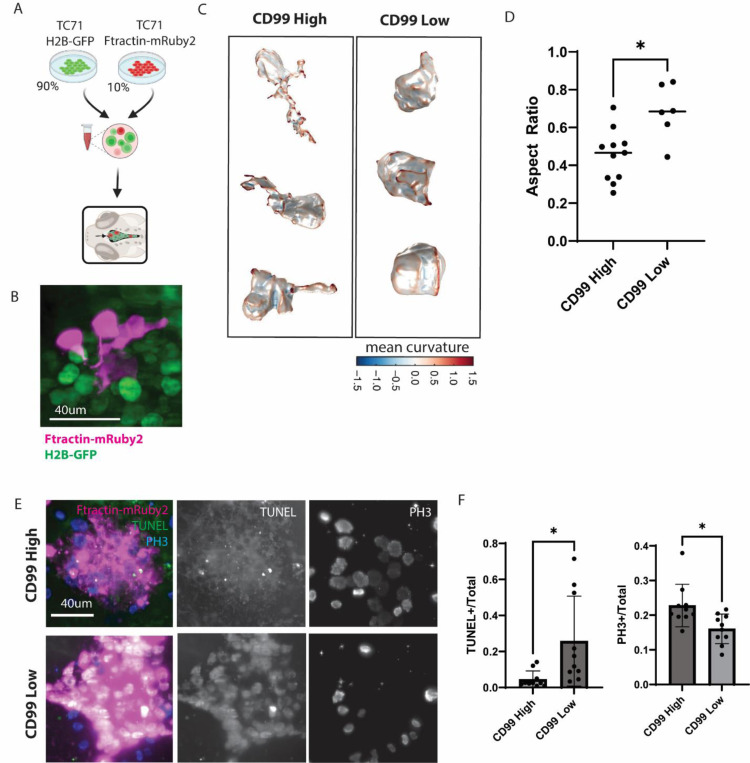
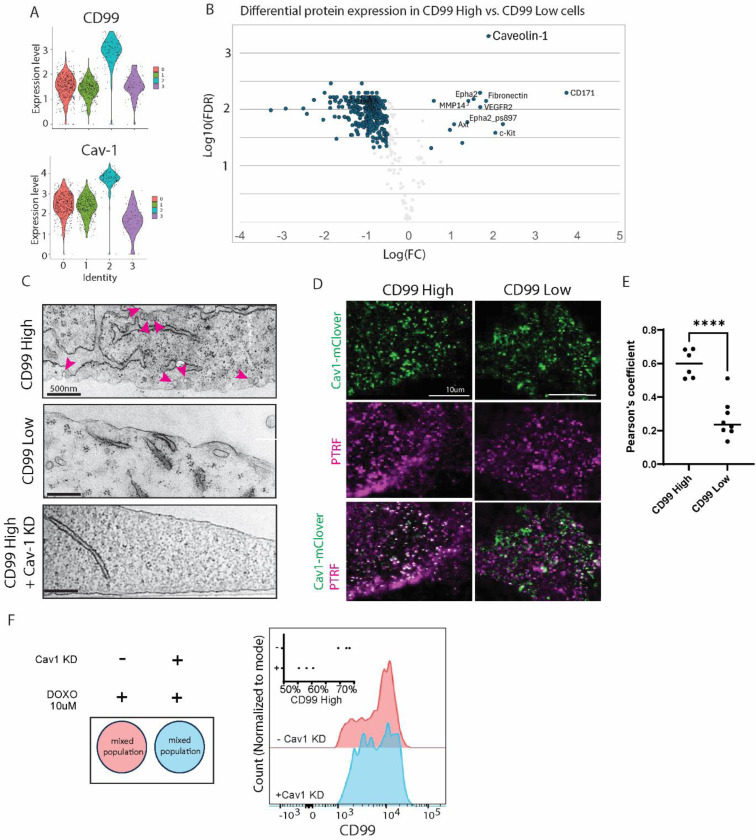
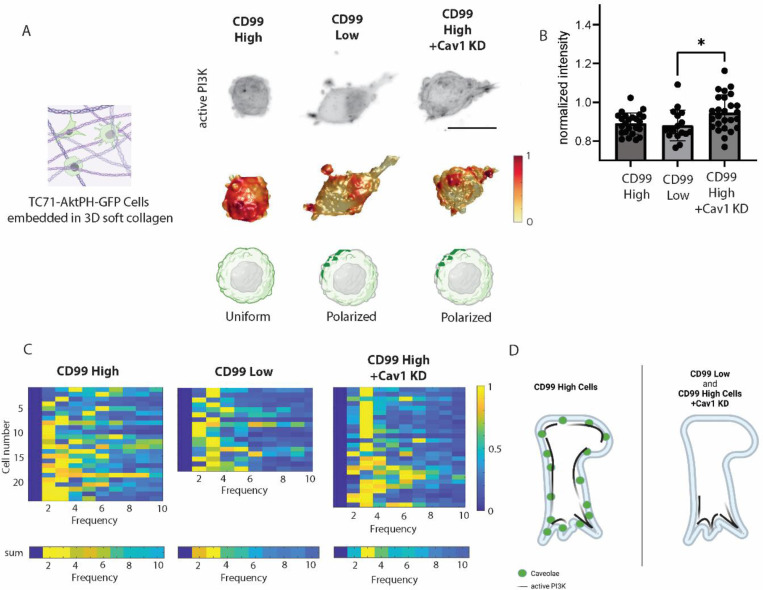
Plasticity is a hallmark function of cancer cells, but many of the underlying mechanisms have yet to be discovered. In this study, we identify Caveolin-1, a scaffolding protein that organizes plasma membrane domains, as a context-dependent regulator of survival signaling in Ewing sarcoma (EwS). Single cell analyses reveal a distinct subpopulation of EwS cells, which highly express the surface marker CD99 as well as Caveolin-1. CD99 High cells exhibit distinct morphology, gene expression, and enhanced survival capabilities compared to CD99 Low cells, both under chemotherapeutic challenge and in vivo. Mechanistically, we show that elevated Caveolin-1 expression in CD99 High cells orchestrates PI3K/AKT survival signaling by modulating the spatial organization of PI3K activity at the cell surface. Notably, CD99 itself is not directly involved in this pathway, making it a useful independent marker for identifying these subpopulations. We propose a model where the CD99 High state establishes a Cav-1-driven signaling network to support cell survival that is distinct from the survival mechanisms of CD99 Low cells. This work reveals a dynamic state transition in EwS cells and highlights Caveolin-1 as a key driver of context-specific survival signaling.


Figures

Figure 1:
Figure 1:. High CD99 marks a distinct Ewing Sarcoma cell state.
(A) Experimental workflow. After 6–10 cycles of mechanical passaging to preserve surface receptors, cells are enzymatically detached from the dish and prepared in a single cell suspension for single cell RNA seq (scRNA-seq) to profile receptor expression, or immunolabeling of target receptor for flow cytometry. (B) Volcano plot depicting differential enrichment of transcripts expression in highlighted cluster (see cluster 2 in Figure S1A) compared to all other cells. Differentially expressed cell surface receptors are indicated; CD99 is highlighted (dashed circle). (C-D) UMAP visualization with log normalized expression of CD99 color-coded in TC71 cells (C), or in NCH-EWS1 patient-derived xenograft (PDX) cells (D), analyzed by scRNA-seq. (E) Flow cytometry histogram depicting relative intensity of CD99 as measured by immunolabeling, displaying a bimodal distribution of CD99 High and CD99 Low cell populations. Distinct populations are highlighted by red bars. (F) CD99 High cells (blue, left) were isolated from a mixed population of CD99 Low and CD99 High cells (red). The isolated CD99 High cells were reevaluated by the same assay (blue, right) after expansion and several rounds of passaging. The recurrent bimodal distribution of CD99 expression suggests that CD99 High cells can shift between CD99 High and CD99 Low cell states.
Figure 2:
Figure 2:. CD99 High and Low cells display differences in morphology, gene expression, and survival.
(A) Maximum Intensity Projections in XY view (left) or YZ view (right) of CD99 High and CD99 Low TC71 cells expressing F-Tractin-GFP and imaged using oblique plane microscopy in adherent culture display distinct cell morphologies (scale bar = 20um). (B) Gene Ontology terms for CD99 High cells show enrichment of neurally differentiated gene signatures. (C) Schematic depicting intratibial xenografts of CD99 High or CD99 Low TC71 cells into immunocompromised mice (left). Weight of tumor-bearing leg normalized to the weight of non-tumor bearing leg of the same mouse in CD99 High (n=6) or CD99 Low (n=6) xenografts (right, asterisk depicts p>0.05, t-test). (D) Representative computer tomography scan of tumor bearing legs depicting differences in presence of bony destruction caused by tumor cells. (E) Histological sections of intratibial xenografts in immunocompromised mice, showing tumor-bearing areas (outlined in red) within the medullary cavity (Med. Cav.) of either CD99 High or CD99 Low cells, labeled with H&E, chemically immunostained for CD99, and fluorescently stained for the apoptotic marker TUNEL or the proliferation marker Ki67 in serial sections. Note the decreased TUNEL staining observed in the CD99 High tumor compared to CD99 Low tumor. (F) Area inside the Med. Cav. of the bone, or outside of the Med. Cav., such as within the surrounding muscle. Note that while CD99 Low cells have larger clusters outside the Med. Cav., CD99 High cells have comparably smaller clusters in both areas (n = 3 mice). Red square indicates CD99 High mouse with no tumor-bearing area found outside Med. Cav. Bars, mean value. (G) Flow cytometry of a mixed population of CD99 High and CD99 Low cells stained with Live/Dead viability dye vs. CD99 immunolabeling, with or without Doxorubicin treatment (DOXO, 0.5uM, 48hrs). (H) Histograms depicting outlined regions from the dot plot in (G), which mark viable, CD99+ cells and show relative distributions of CD99 Low and CD99 High populations grown with (+, blue) or without (-, magenta) DOXO (n=3 independent experiments). Inset shows percentage enrichment of CD99 High cells in each group. CD99 High cells are systematically enriched upon drug treatment.
Figure 3:
Figure 3:. CD99 High and Low cells display differences in morphology and survival in zebrafish xenografts.
(A) Experimental set-up to identify single-cell morphologies in xenografted cells within the hindbrain ventricle (HBV) of zebrafish larvae. In order to distinguish single-cell morphologies of individual cells, we prepared a mosaic cell mixture consisting of 90% of TC71 unsorted cells expressing the fluorescently-tagged nuclear marker H2B-GFP, and 10% of TC71 CD99 High or CD99 Low cells expressing F-Tractin-mRuby2. (B) Maximum Intensity Projection of TC71 cells within the HBV expressing F-Tractin-mRuby2 (magenta) or H2B-GFP (green). (C) Volume renderings of 3 representative single cells from each class, pseudocolored by local membrane curvature. Note the highly elongated and protrusive shapes observed in CD99 High cells. (D) Differences in aspect ratio of individual cells, as a metric of differences in cell shape in CD99 High (n = 11 cells, 9 fish) and CD99 Low cells (n=6 cells, 3 fish, p-value<0.5, t-test). (E) TC71 CD99 High or CD99 Low cells expressing F-tractin-mRuby2 (magenta) were injected into the HBV of zebrafish larvae, and stained for apoptotic marker TUNEL (green (left), grey (middle)) and proliferative marker Phospho-histone H3 (PH3, blue (left), grey (right)) 48hrs post-injection. Maximum Intensity Projections show increased TUNEL staining in CD99 Low cells. (F) Proportion of measured area of TUNEL-positive (left) or PH3-positive (right) signal overlapping with F-Tractin-mRub2 expressing cells (n=10 fish). Note decreased cell death and higher proliferation in CD99 High cells.
Figure 4:
Figure 4:. Caveolin-1 emerges as a potential driver of functions associated with the CD99 High State.
(A) RNA expression of CD99 and Cav1 in different clusters, analyzed from scRNA-seq data (see Fig S1). (B) Volcano plot of differential protein expression between CD99 High vs. CD99 Low cells, analyzed by Reverse Phase Protein Array (RPPA). (C) Representative scanning electron microscope images of CD99 High, CD99 Low, and CD99 High cells expressing inducible Cav-1 shRNA (Cav1 KD). Magenta arrowheads highlight observed caveolae in CD99 High cells. (D-E) Representative images (D), and quantification of colocalization by Pearson’s coefficient (E) of TC71 CD99 High or CD99 Low cells with endogenous expression for Cav1-mClover, and immunostained for PTRF show colocalization of Cav1 and PTRF in CD99 High but not CD99 Low cells (n=6,8 cells, respectively, t-test, ****p-value<0.0001). (F) Experimental setup for a flow cytometry assay of a mixture of TC71 CD99 High and CD99 Low cells, with (blue) or without (red) knockdown of Cav-1, grown with Doxorubicin (DOXO, 10uM, 48hrs). Histogram of CD99 High and CD99 Low populations. Representative of n=3 experiments. Inset, percentage enrichment of CD99 High cells in each group (n=3). Note that enrichment of CD99 High peak under DOXO treatment is lost upon Cav1 KD.
Figure 5:
Figure 5:. Caveolin-1 regulates PI3K/AKT signaling in CD99 High Cells.
(A) TC71 CD99 High and CD99 Low cells, and CD99 High cells +Cav1 KD, expressing PI3K activation sensor AktPH-GFP. Cells were embedded in soft collagen. (Top) Maximum Intensity Projection of raw data (scale bar 20um). (Middle) surface rendering of the same cell, with localization of PI3K activity projected onto the 3D cell surface. Red surface regions indicate high local PI3K activity. (Bottom) Schematics showing uniform or polarized PI3K activity distribution observed in each experimental group. (B) PI3K activity measured as total sum intensity on the cell surface normalized to mean intensity of cell volume. Note the slight increase of total PI3K activity in CD99 High + Cav1 KD (n = 24, 17, and 26 cells, for CD99 High, CD99 Low, and CD99 High +Cav1 KD, respectively. * p-value<0.05, KS test). (C) (top) Heatmaps depicting normalized spatial energy spectra of PI3K signaling pattern on the cell surface. Continuous spectra are binned and normalized to the highest bin. Each row represents a single cell. Low bins encode signaling variations over long distances, high bins short variations over short distances. Thus, cells with a polarized signaling distribution display a primary high energy bin (yellow) at lower frequencies, while cells with a more uniform signal distribution display several smaller bins with similar energy levels. (bottom) Sum of binned and normalized energy values across all cells. Note that CD99 High cells show a more uniform distribution of active PI3K compared to CD99 Low cells. CD99 High cells +Cav1 KD show more polarized signal distributions, similar to CD99 Low cells and significantly different from CD99 High cells (p-value =.02, permutation test of Mean Absolute Deviation). (D) Summary of proposed mechanism. CD99 High cells have high expression of Cav-1 and dense caveolae to organize the membrane, possibly through stabilization of lipid rafts. These make docking sites promiscuously available to PI3K localization, enhancing opportunities for stable signaling across the entire cell surface. CD99 Low cells, or CD99 High cells with reduced Cav-1 expression lack caveolae, causing PI3K localization to be concentrated to areas of high local curvature such as protrusions, as described in other works.

Similar articles

References

    1. Hanahan D. & Weinberg R.A. Hallmarks of cancer: the next generation. Cell 144, 646–674 (2011). - PubMed
    1. Quintanal-Villalonga A. et al. Lineage plasticity in cancer: a shared pathway of therapeutic resistance. Nat Rev Clin Oncol 17, 360–371 (2020). - PMC - PubMed
    1. Grobner S.N. et al. The landscape of genomic alterations across childhood cancers. Nature 555, 321–327 (2018). - PubMed
    1. Crompton B.D. et al. The genomic landscape of pediatric Ewing sarcoma. Cancer Discov 4, 1326–1341 (2014). - PubMed
    1. Grunewald T.G.P. et al. Ewing sarcoma. Nat Rev Dis Primers 4, 5 (2018). - PubMed

Publication types

LinkOut - more resources