

This is a preprint.
Calibration-free estimation of field dependent aberrations for single molecule localization microscopy across large fields of view
- PMID: 39713420
- PMCID: PMC11661230
- DOI: 10.1101/2024.12.11.627909
Calibration-free estimation of field dependent aberrations for single molecule localization microscopy across large fields of view
Abstract
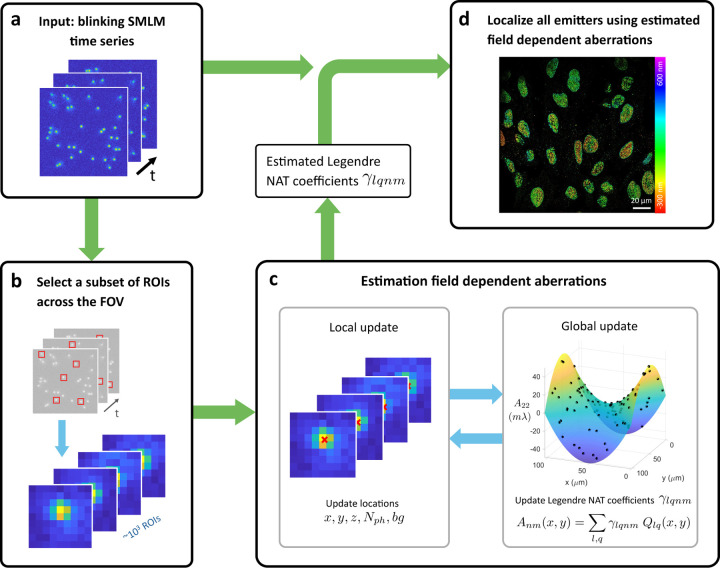
Image quality in single molecule localization microscopy (SMLM) depends largely on the accuracy and precision of the localizations. While under ideal imaging conditions the theoretically obtainable precision and accuracy are achieved, in practice this changes if (field dependent) aberrations are present. Currently there is no simple way to measure and incorporate these aberrations into the Point Spread Function (PSF) fitting, therefore the aberrations are often taken constant or neglected all together. Here we introduce a model-based approach to estimate the field-dependent aberration directly from single molecule data without a calibration step. This is made possible by using nodal aberration theory to incorporate the field-dependency of aberrations into our fully vectorial PSF model. This results in a limited set of aberration fit parameters that can be extracted from the raw frames without a bead calibration measurement, also in retrospect. The software implementation is computationally efficient, enabling fitting of a full 2D or 3D dataset within a few minutes. We demonstrate our method on 2D and 3D localization data of microtubuli and nuclear pore complexes over fields of view (FOV) of up to 180 μm and compare it with spline-based fitting and a deep learning based approach.
Figures


Similar articles
-
Assessing the comparative effects of interventions in COPD: a tutorial on network meta-analysis for clinicians.Respir Res. 2024 Dec 21;25(1):438. doi: 10.1186/s12931-024-03056-x. Respir Res. 2024. PMID: 39709425 Free PMC article. Review.
-
Cauliflower leaf diseases: A computer vision dataset for smart agriculture.Data Brief. 2025 Apr 28;60:111594. doi: 10.1016/j.dib.2025.111594. eCollection 2025 Jun. Data Brief. 2025. PMID: 40534720 Free PMC article.
-
Molecular feature-based classification of retroperitoneal liposarcoma: a prospective cohort study.Elife. 2025 May 23;14:RP100887. doi: 10.7554/eLife.100887. Elife. 2025. PMID: 40407808 Free PMC article.
-
The ultimate power play in research - partnering with patients, partnering with power.Res Involv Engagem. 2025 Jun 17;11(1):65. doi: 10.1186/s40900-025-00745-9. Res Involv Engagem. 2025. PMID: 40528262 Free PMC article.
-
Defining disease severity in atopic dermatitis and psoriasis for the application to biomarker research: an interdisciplinary perspective.Br J Dermatol. 2024 Jun 20;191(1):14-23. doi: 10.1093/bjd/ljae080. Br J Dermatol. 2024. PMID: 38419411 Free PMC article. Review.
References
-
- Betzig E., Patterson G.H., Sougrat R., Lindwasser O.W., Olenych S., Bonifacino J.S., Davidson M.W., Lippincott-Schwartz J., and Hess H.F.. Imaging Intracellular Fluorescent Proteins at Nanometer Resolution. Science, 313:1642–1645, 2006. - PubMed
-
- Heilemann M., van de Linde S., Schüttpelz M., Kasper R., Seefeldt B., Mukherjee A., Tinnefeld P., and Sauer M.. Subdiffraction-resolution fluorescence imaging with conventional fluorescent probes. Angewandte Chemie, 47(33):6172–6176, 2008. - PubMed
Additional references
-
- Martens K.J.A., Bader A.N., Baas S., Rieger B., and Hohlbein J.. Phasor based single-molecule localization microscopy in 3D (pSMLM-3D): an algorithm for MHz localization rates using standard CPUs. Journal of Chemical Physics, 148:123311, 2018. - PubMed
-
- Stallinga S. and Rieger B.. Accuracy of the Gaussian point spread function model in 2D localization microscopy. Optics Express, 18(24):24461–24476, 2010. - PubMed
-
- Bakx J. L., Efficient computation of optical disk readout by use of the chirp z transform, Applied Optics 41, 4879–4903, 2002. - PubMed
-
- Cnossen J., Ju Cui T., Joo C., and Smith C.S.. Drift correction in localization microscopy using entropy minimization. Optics Express, 29(18):27961–27974, 2021. - PubMed
Publication types
Grants and funding
LinkOut - more resources
Full Text Sources