[Preprint]. 2024 Dec 12:2024.12.11.627969.
doi: 10.1101/2024.12.11.627969.

Calmodulin binding is required for calcium mediated TRPA1 desensitization

Affiliations

Calmodulin binding is required for calcium mediated TRPA1 desensitization

Justin H Sanders et al. bioRxiv. .

Abstract

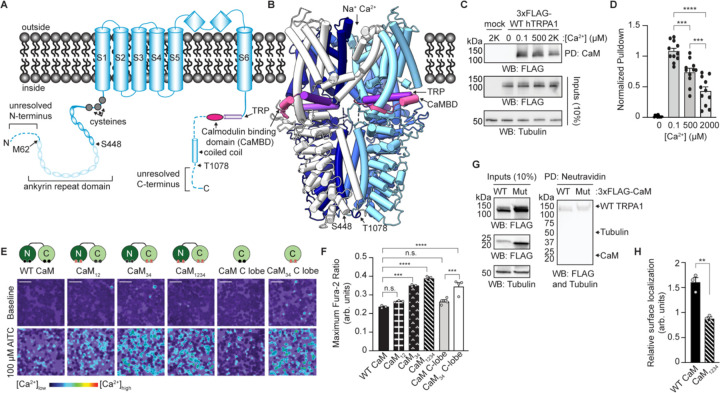
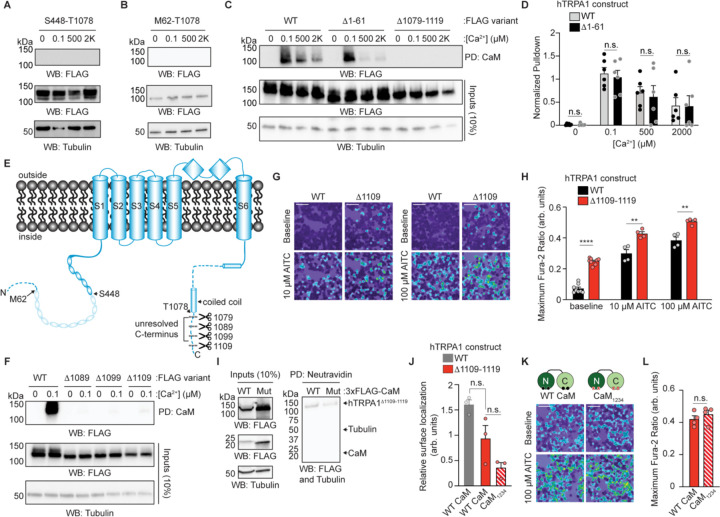
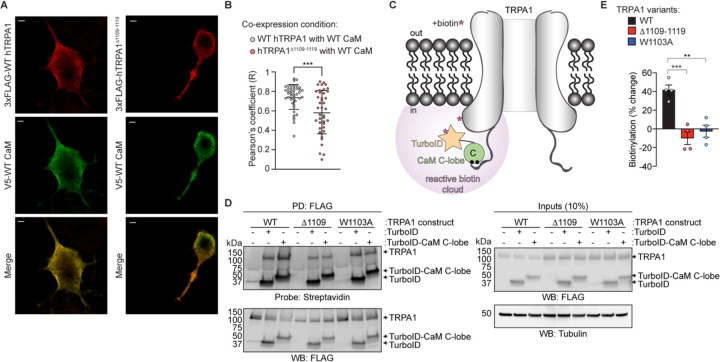
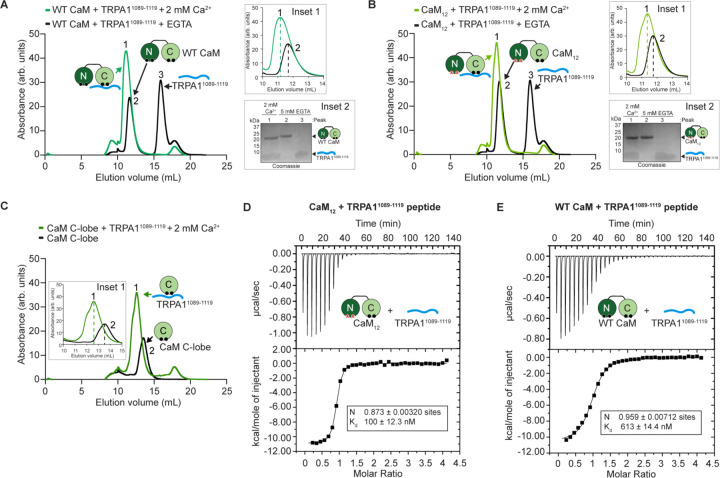
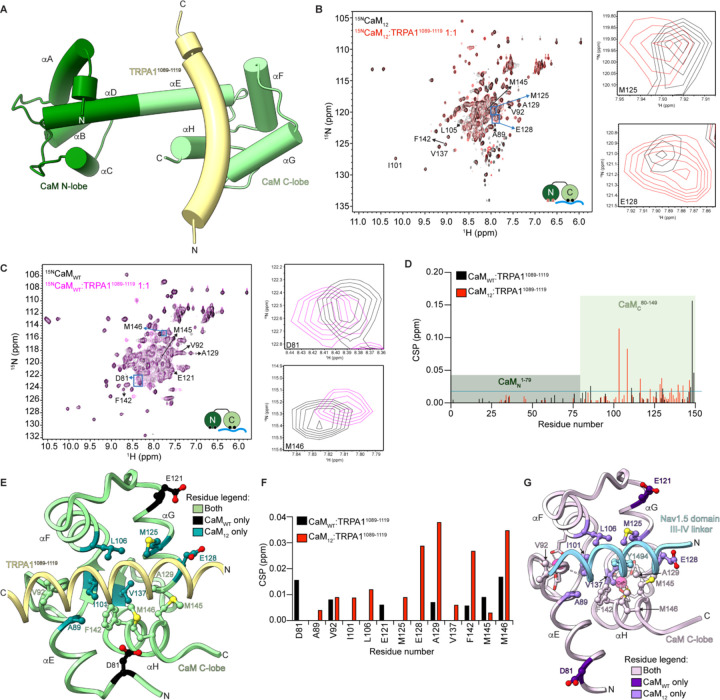
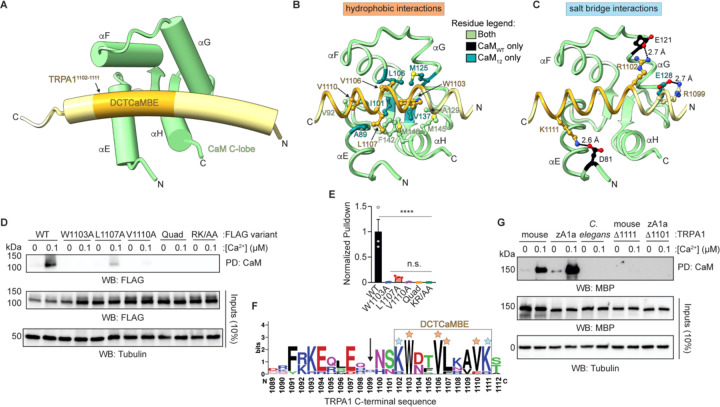
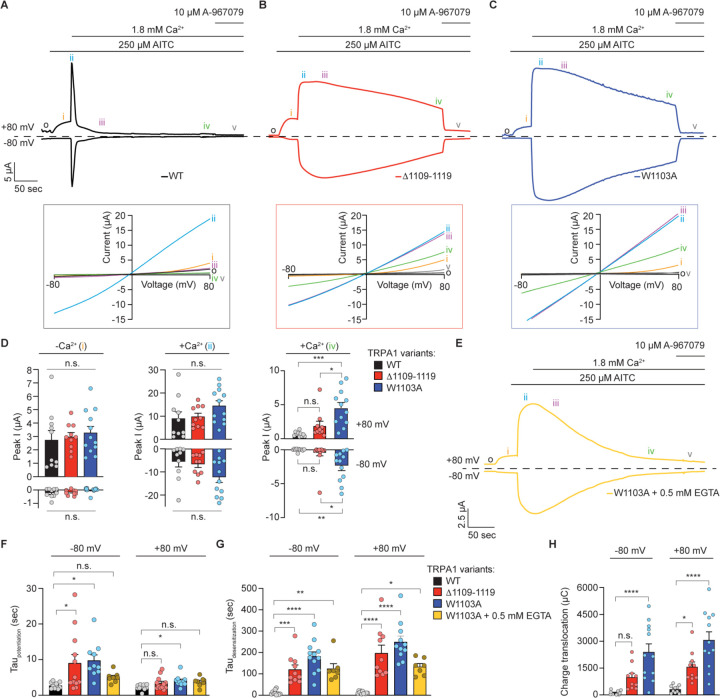
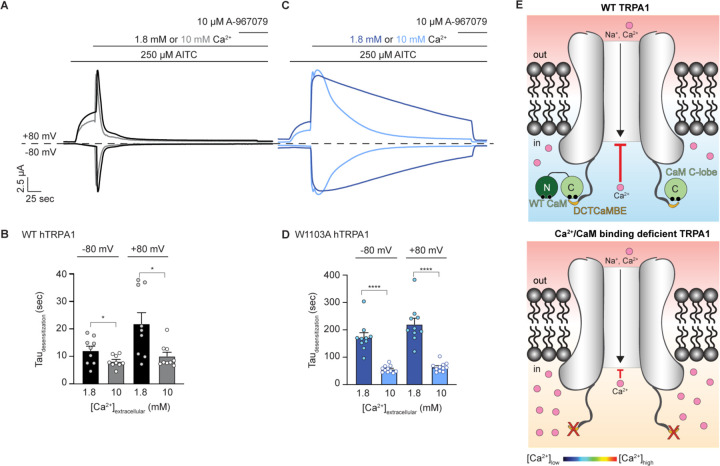
Calcium (Ca2+) ions affect nearly all aspects of biology. Excessive Ca2+ entry is cytotoxic and Ca2+-mobilizing receptors have evolved diverse mechanisms for tight regulation that often include Calmodulin (CaM). TRPA1, an essential Ca2+-permeable ion channel involved in pain signaling and inflammation, exhibits complex Ca2+ regulation with initial channel potentiation followed by rapid desensitization. The molecular mechanisms of TRPA1 Ca2+ regulation and whether CaM plays a role remain elusive. We find that TRPA1 binds CaM best at basal Ca2+ concentration, that they co-localize in resting cells, and that CaM suppresses TRPA1 activity. Combining biochemical, biophysical, modeling, NMR spectroscopy, and functional approaches, we identify an evolutionarily conserved, high-affinity CaM binding element in the distal TRPA1 C-terminus (DCTCaMBE). Genetic or biochemical perturbation of Ca2+/CaM binding to the TRPA1 DCTCaMBE yields hyperactive channels that exhibit drastic slowing of desensitization with no effect on potentiation. Ca2+/CaM TRPA1 regulation does not require the N-lobe, raising the possibility that CaM is not the Ca2+ sensor, per se. Higher extracellular Ca2+ can partially rescue slowed desensitization suggesting Ca2+/CaM binding to the TRPA1 DCTCaMBE primes an intrinsic TRPA1 Ca2+ binding site that, upon binding Ca2+, triggers rapid desensitization. Collectively, our results identify a critical regulatory element in an unstructured TRPA1 region highlighting the importance of these domains, they reveal Ca2+/CaM is an essential TRPA1 auxiliary subunit required for rapid desensitization that establishes proper channel function with implications for all future TRPA1 work, and they uncover a mechanism for receptor regulation by Ca2+/CaM that expands the scope of CaM biology.


Conflict of interest statement

Competing Interests: The authors declare no competing interests.

Figures

Figure 1.
Figure 1.
Calmodulin (CaM) C-lobe binding regulates TRPA1 activity. (A) Cartoon schematic of a full-length hTRPA1 monomeric subunit with relevant structural features and a previously identified Calmodulin binding domain (CaMBD, pink) denoted. Dashes and transparencies indicate unresolved regions in Cryo-EM structures. Residues denoted with arrows indicate positions of truncations used in this study. (B) Ribbon diagram of WT hTRPA1 atomic model for residues S448-T1078 from the homotetrameric channel (PDB: 6V9W). Each subunit is colored differently for clarity. The CaMBD and TRP helix are colored as in A. (C) WT TRPA1 interacts with CaM in a Ca2+-dependent manner. Immunoblotting analysis of 3xFLAG-WT hTRPA1 after CaM-agarose pulldown at the indicated Ca2+ concentrations from lysates of HEK293T cells transfected with 3xFLAG-WT hTRPA1 or empty vector (mock). Samples were probed using an HRP-conjugated anti-FLAG antibody. Tubulin from whole cell lysates (10%, inputs) was the loading control. (D) Quantitative analysis of CaM-agarose enrichment of 3xFLAG-WT hTRPA1 at the indicated Ca2+ concentrations relative to the maximum enrichment within each replicate. Data represent mean ± SEM. ***p=0.0003 (0.1 versus 500 µM Ca2+), ***p=0.0008 (500 versus 2000 µM Ca2+), ****p<0.0001 (0.1 versus 2000 µM Ca2+). n=11, one-way ANOVA with Tukey’s post hoc analysis. (E) Co-expression with a functional CaM C-lobe suppresses WT TRPA1 activity. Ratiometric Ca2+ imaging of HEK293T cells transfected with WT hTRPA1 and WT or the indicated CaM mutants. Cells were stimulated with 100 µM AITC. Images are representative of three (WT CaM, CaM12, CaM34, and CaM1234) or four (CaM C-lobe and CaM34 C-lobe) independent experiments. Scale bars indicate 50 µm. (F) Quantification of 100 µM AITC-evoked change in Fura-2 ratio of data from panel (E). Data represent mean ± SEM. ****, p<0.0001, ***p=0.001 (WT CaM versus CaM34) or 0.0007 (CaM C-lobe versus CaM34 C-lobe), n.s. not significant p>0.05. n= 3 (WT CaM, CaM12, CaM34, and CaM1234) or 4 (CaM C-lobe and CaM34 C-lobe) independent replicates, one-way ANOVA with Tukey’s post hoc analysis. (G) Surface biotinylation. Immunoblotting analysis of 3xFLAG-WT hTRPA1, 3xFLAG-WT CaM or 3xFLAG-CaM1234 protein expression in biotin-labeled plasma membranes from transfected cells. Biotinylated proteins were precipitated by Neutravidin resin pulldown and probed as in Fig. 1C. CaM and Tubulin were the negative controls for plasma membrane localization. (H) Quantitative analysis of the plasma membrane localization of 3xFLAG-WT hTRPA1 relative to Tubulin inputs. Data represent mean ± SEM. **p=0.0025, n=3, two-tailed Student’s t-test.
Figure 2.
Figure 2.
Identification of a Ca2+/CaM binding element in the TRPA1 distal C-terminus. (A-C, F) Representative immunoblotting analysis of 3xFLAG-tagged WT or truncation hTRPA1 constructs after CaM-agarose pulldown at the indicated Ca2+ concentrations from lysates of transfected HEK293T cells. Samples were probed as in Fig. 1C. Data are representative of three (A, B, and F) or six (C) independent experiments. Truncations in A-C are diagramed in Fig. 1A. (D) Quantitative analysis of CaM-agarose enrichment of 3xFLAG-WT hTRPA1 (grey) or 3xFLAG-hTRPA1Δ1–61 (black) at the indicated Ca2+ concentrations relative to the maximum enrichment within each replicate. Data represent mean ± SEM. n.s. not significant p>0.05, n=6, two-tailed Student’s t-test. (E) Simplified cartoon schematic from Fig. 1A denoting sites of truncations used in A-D and a suite of hTRPA1 unresolved C-terminus truncations tested in F-L. (G) Ratiometric Ca2+ imaging of HEK293T cells transfected with 3xFLAG-WT hTRPA1 or 3xFLAG-hTRPA1Δ1109–1119. Cells were stimulated with AITC (10 or 100 µM). Images are representative of four independent experiments. Scale bars indicate 50 µm. (H) Quantification of baseline, 10 µM or 100 µM AITC-evoked changes in Fura-2 ratio from cells in (G) transfected with WT hTRPA1 (black) or hTRPA1Δ1109–1119 (red). Data represent mean ± SEM. ****p<0.0001 (baseline), **p=0.0043 (10 µM AITC), and **p=0.0025 (100 µM AITC). n = 4 independent experiments, n ≥ 90 cells per transfection condition per experiment, two-tailed Student’s t-test. (I) Surface biotinylation. Immunoblotting analysis of 3xFLAG-hTRPA1Δ1109–1119, 3xFLAG-WT CaM or 3xFLAG-CaM1234 protein expression in biotin-labeled plasma membranes from transfected cells. Biotinylated proteins were precipitated by Neutravidin resin pulldown and probed as in Fig. 1G. CaM and Tubulin were the negative controls for plasma membrane localization. (J) Quantitative analysis of the plasma membrane localization of 3xFLAG-WT hTRPA1 (grey) or 3xFLAG-hTRPA1Δ1109–1119 (red) relative to Tubulin. WT hTRPA1 quantification is repeated from Fig. 1H. Data represent mean ± SEM. n.s. not significant p>0.05, n=3, one-way ANOVA with Bonferroni’s post hoc analysis. (K) Ratiometric Ca2+ imaging of HEK293T cells co-transfected with 3xFLAG-hTRPA1Δ1109–1119 and 3xFLAG-WT CaM or CaM1234. Cells were stimulated with 100 µM AITC. Images are representative of four independent experiments. Scale bars indicate 50 µm. (L) Quantification of 100 µM AITC-evoked change in Fura-2 ratio of data from panels (K) of cells co-expressing hTRPA1Δ1109–1119 and WT CaM (red bars) or CaM1234 (striped bars). Data represent mean ± SEM. n.s. not significant (p>0.05). n = 4 independent experiments, n ≥ 90 cells per transfection condition per experiment, two-tailed Student’s t-test.
Figure 3.
Figure 3.
TRPA1 and CaM co-localize in cells. (A) Representative deconvolved Airyscan images of Neuro2A cells co-expressing 3xFLAG-WT hTRPA1 (left) or hTRPA1Δ1109–1119 (right) with V5-WT CaM. Cells were stained with anti-FLAG (red) and anti-V5 (green) antibodies. Scale bar indicates 2 µm. Images are representative of 3 independent experiments. (B) Pearson’s correlation coefficients (R) were determined for WT hTRPA1:WT CaM or hTRPA1Δ1109–1119:WT CaM using raw images (see Fig. S3). Data represent mean ± SD. ***p=0.0002, n=41 (WT) or 40 (Δ1109–1119) cells from 3 independent experiments, two-tailed Student’s t-test. n >10,000 pixels in 1 cell per condition. (C) Proximity biotinylation approach. TurboID (orange star) fused to the CaM C-lobe (green circle) is co-expressed with TRPA1 variants (black) in cells. Addition of biotin (pink star) to the media will facilitate generation of a local reactive biotin cloud (purple) that will biotinylate TurboID-CaM C-lobe and TRPA1, pending an interaction. (D) Immunoblotting analysis of biotinylated 3xFLAG-WT hTRPA1, hTRPA1Δ1109–1119, or W1103A hTRPA1 co-expressed with empty vector (−), 3xFLAG-TurboID-CaM C-lobe, or 3xFLAG-TurboID in HEK293T cells. FLAG immunoprecipitated eluates were probed for biotinylation with Streptavidin-HRP. FLAG-tagged proteins were probed using HRP-conjugated anti-FLAG antibody. Tubulin was the loading control. Blots representative of four independent experiments. (E) Quantification of the percent change to TRPA1 biotinylation with TurboID-CaM C-lobe versus TurboID from experiments as in (D). Pulldown Streptavidin-HRP (e.g., biotinylation) was normalized to FLAG and Tubulin from inputs for each sample. Biotinylation by TurboID was subtracted from biotinylation by TurboID-CaM C-lobe. Data are presented as the percent change from biotinylation with TurboID. Data represent mean ± SEM. ***p=0.0005, **p=0.0013. n = 4 independent experiments, one-way ANOVA with Bonferroni’s post hoc analysis.
Figure 4.
Figure 4.
The TRPA1 distal C-terminus contains a high affinity Ca2+/CaM binding site. (A and B) Superdex 75 chromatograms of WT CaM (A) or CaM12 (B) with hTRPA11089–1119 in the presence of 2 mM Ca2+ (green) or 5 mM EGTA (black). Inset 1 zooms in on the CaM and CaM:peptide peaks (peaks labeled 1 and 2). Inset 2 are Coomassie stains of fractions labeled 1 (green trace), 2 (black trace), and 3 (black trace). Arrows indicate CaM constructs and hTRPA11089–1119 peptide. (C) Superdex 75 chromatograms of CaM C-lobe alone (black) or with hTRPA11089–1119 in the presence of 2 mM Ca2+ (green). Chromatograms in A, B, and E were generated from 100 µM protein for each construct. Data are representative of three independent replicates. (D and E) The TRPA1 distal C-terminus has a higher affinity for CaM12 than WT CaM. Representative isothermal titration calorimetry plots of CaM12 (D) or WT CaM (E) titrated by hTRPA11089–1119 peptide at 2 mM Ca2+ and fitted using the one-site binding model. Values for the number of binding sites (N) and the binding constant Kd are shown.
Figure 5.
Figure 5.
Analysis of the TRPA1 C-terminal tail Ca2+/CaM binding mode. (A) Ribbon diagram of the WT CaM atomic model (N-lobe, dark green, residues 1–79; C-lobe, light green, residues 80–149) in complex with part of the hTRPA1 C-terminus (yellow, residues 1089–1119) as predicted by AlphaFold2 Multimer. (B) Overlay of the 15N-1H HSQC spectra of 15N-labled CaM12 (black) with the 15N-labeled CaM12:TRPA11089–1119 complex (red) at a 1:1 molar ratio. Insets depicts expanded view of the CSPs boxed in blue. (C) Overlay of the 15N-1H HSQC spectra of 15N-labled CaMWT (black) with the 15N-labeled CaMWT:TRPA11089–1119 complex (purple) at a 1:1 molar ratio. Insets depict expanded view of the CSPs boxed in blue. (D) CaM12 (red) and CaMWT (black) chemical shift perturbations (CSPs) (δbound - δfree) as a function of residue number for the 15N-labeled CaM12:TRPA11089–1119 or 15N-labeled CaMWT:TRPA11089–1119 complex as in panels B and C, respectively. Dark and light green shadings denote CaM N- and C-lobe residues, respectively. The mean value plus one standard deviation is the horizontal blue line. (E) Ribbon diagram of the CaM C-lobe atomic model (green, residues 80–149) in complex with part of the hTRPA1 C-terminus (yellow, residues 1089–1119) as predicted by AlphaFold2 Multimer. Residues exhibiting CSPs from the 15N-labeled CaMWT:TRPA11089–1119 complex (black), the 15N-labeled CaM12:TRPA11089–1119 complex (teal), and both complexes (green) that face the TRPA1 C-terminus are depicted as balls and sticks. (F) CaMWT (black) or CaM12 (red) CSPs for the C-lobe residues modeled in E from the 15N-labeled CaM12:TRPA11089–1119 or CaMWT:TRPA11089–1119 complexes from panels B and C, respectively. (G) Ribbon diagram of the crystal structure of the Ca2+/CaM:Nav1.5 DIII-IV linker complex (PDB entry 4DJC) (Sarhan et al PNAS 2012 109: 3558–3563). The CaM C-lobe (purple), Nav1.5 peptide (blue), and Ca2+ ions (pink) are indicated. The CaM C-lobe residues exhibiting CSPs from the 15N-labeled CaMWT:TRPA11089–1119 complex (dark purple), the 15N-labeled CaM12:TRPA11089–1119 complex (medium purple), and both complexes (light purple) from panel E and F are depicted as balls and sticks. The key Nav1.5 interacting residue Y1494 is highlighted (blue).
Figure 6.
Figure 6.
Identification of key and conserved TRPA1 DCTCaMBE residues involved in Ca2+/CaM binding. (A) (Right) Ribbon diagram of the CaM C-lobe atomic model (green, residues 80–149) in complex with part of the hTRPA1 C-terminus (yellow, residues 1089–1119) as predicted by AlphaFold2 Multimer. The region proposed to form the distal C-terminal CaM binding element (DCTCaMBE, hTRPA1 residues R1102-K1111) is indicated in goldenrod. (B and C) Ribbon diagrams with residues mediating hydrophobic interactions (B) or salt bridge interactions (C) depicted as balls and sticks. Residues colored as in Fig. 5E. The highlighted CaM residues exhibited CSPs in 2D NMR data sets (see Fig. 5F). (D) Immunoblotting analysis of the indicated 3xFLAG-hTRPA1 constructs after CaM-agarose pulldown in the absence or presence of Ca2+ from lysates of HEK293T cells transfected with 3xFLAG-WT, W1103A, L1107A, V1110A, W1103A/V1106A/L1107A/V1110A (Quad), or R1102A/K1111A (RK/AA) hTRPA1. Blot is representative of three independent experiments. Samples were probed as in Fig. 1C. (E) Quantification of CaM-agarose pulldowns represented in D. Pulldown was normalized to the WT hTRPA1 with Ca2+ average. Data represent mean ± SEM. ****p<0.0001, n.s. not significant (p>0.05). n = 3 independent experiments, one-way ANOVA with Tukey’s post hoc analysis. (F) Sequence alignment of nine TRPA1 orthologues aligned to residues 1089–1112 of hTRPA1. Alignment generated with Sequence Logo. Arrow denotes poorly conserved hTRPA1 R1099. Box denotes TRPA1 DCTCaMBE. Hydrophobic (orange) and salt bridge (blue) residues proposed to form the DCTCaMBE are denoted with stars. (G) Immunoblotting analysis of the indicated MBP-TRPA1 species orthologue constructs after CaM-agarose pulldown in the absence or presence of Ca2+ from lysates of HEK293T cells transfected with MBP-WT mouse, zebrafish TRPA1a isoform (zA1a), or C. elegans TRPA1 or the Δ1109–1119 equivalents of mouse (Δ1111–1125) or zebrafish (Δ1101–1115) TRPA1. Blot is representative of four independent experiments. Samples were probed using an anti-MBP primary antibody and an HRP-conjugated anti-mouse secondary antibody. Tubulin from whole cell lysates (10%, inputs) was the loading control.
Figure 7.
Figure 7.
Ca2+/CaM binding is critical for TRPA1 desensitization. (A-C) Representative time-traces at −80 and +80 mV holding potentials from oocytes expressing WT (A, black), Δ1109–1119 (B, red), or W1103A hTRPA1 (C, blue). Current evoked with 250 µM AITC in the absence (orange i) and presence (blue ii) of 1.8 mM extracellular Ca2+. Channels were blocked with 10 µM A-967079 (grey v). Dashed line denotes 0 µA current. Protocol of condition application indicated above. Boxed below are the corresponding current-voltage relationships from timepoints indicated by black o (baseline), orange i (AITC without Ca2+), blue ii (AITC with Ca2+), purple iii (25 seconds after Ca2+ addition), green iv (5 minutes after Ca2+ addition), and grey v (A-967079 inhibited). (D) Quantification of peak current amplitudes at +80 mV (above) and −80 mV (below) before (orange i, left), 25 seconds after (blue ii, middle), and 5 minutes after (green iv, right) Ca2+ addition. Colors as indicated in A-C. Data represent mean ± SEM. ***p=0.0002, **p=0.0026, *p=0.0132 or 0.0217 (+80 and −80 mV, respectively), n.s. not significant. (E) Representative time-traces at −80 and +80 mV holding potentials from oocytes expressing W1103A hTRPA1 and pre-treated with 0.5 mM EGTA-AM (yellow) 20 minutes prior to recordings to chelate global intracellular Ca2+. Dashed line denotes 0 µA current. Protocol of condition application indicated above and timepoints marked as in A-C. (F and G) Calculated time constants of potentiation (F) and desensitization (G) at −80 mV (left) and +80 mV (right) from fitting data as in A-C and E to a single-exponential function. Data represent mean ± SEM. *p=0.0266 (WT versus Δ1109–1119, −80 mV, tau potentiation), *p=0.0166 and 0.0287 (WT versus W1103A, −80 mV and +80 mV, respectively, tau potentiation), ***p=0.0007 (WT versus Δ1109–1119, −80 mV, tau desensitization), **p=0.0014 (WT versus W1103A with 0.5 mM EGTA, −80 mV, tau desensitization), *p=0.0119(WT versus W1103A with 0.5 mM EGTA, +80 mV, tau desensitization) ****p<0.0001, n.s. not significant. Colors as indicated in legend. (H) Quantification of charge translocation (µA•s, µC, e.g., area under the curve) at −80 mV (left) and +80 mV (right) from oocytes used as in A-C. Data represent mean ± SEM. *p=0.0408 (WT versus Δ1109–1119, −80 mV), ****p<0.0001, n.s. not significant (p>0.05). Colors as indicated in legend from panel D. (D and F-H) n= 10 (WT and Δ1109–1119 hTRPA1), 12 (W1103A hTRPA1) or 8 (W1103A hTRPA1 with 0.5 mM EGTA) oocytes per condition, one-way ANOVA with Bonferroni’s post hoc analysis.
Figure 8.
Figure 8.
Loss of Ca2+/CaM binding at the TRPA1 DCTCaMBE can be partially rescued by high extracellular Ca2+. (A and C) Representative time-traces at −80 and +80 mV holding potentials from oocytes expressing WT (A) or W1103A hTRPA1 (C). Current evoked with 250 µM AITC in the absence and presence of 1.8 mM (black/dark blue) or 10 mM (grey/light blue) extracellular Ca2+. Channels were blocked with 10 µM A-967079. Dashed line denotes 0 µA current. Protocol of condition application indicated above. Extracellular solutions contained 125 µM niflumic acid (NFA). (B and D) Calculated time constants of desensitization from fitting data as in (A) and (C) at 1.8 or 10 mM extracellular calcium to a single-exponential function. Data represent mean ± SEM. ****p<0.001, *p= 0.0424 (WT hTRPA1, −80 mV) or 0.0146 (WT hTRPA1, +80 mV). n= 9 (WT), 10 (W1103A, 1.8 mM Ca2+) or 11 (W1103A, 10 mM Ca2+) oocytes per condition, two-tailed Student’s t-test. (E) Model illustrating Ca2+ desensitization of TRPA1 (red inhibition arrow) in a WT channel (top) versus a Ca2+/CaM binding deficient channel (bottom). Channel activation facilitates permeation of sodium (Na+) and Ca2+ ions into the cytoplasm. WT CaM (dumbbell) or the CaM C-lobe (green circle) binding to the TRPA1 DCTCaMBE (yellow) in the distal unstructured C-terminus primes TRPA1 for rapid desensitization following Ca2+ permeation (top, blue color on the Ca2+ concentration heat map). When the TRPA1:Ca2+/CaM interaction is disrupted, channels remain active allowing intracellular Ca2+ concentrations to rise (bottom, orange color on the Ca2+ concentration heat map) before incomplete desensitization is observed.

Similar articles

References

    1. Clapham D. E. Calcium signaling. Cell 131, 1047–1058 (2007). - PubMed
    1. Averbeck B. in Encyclopedia of Pain 1320–1322 (Springer, 2007).
    1. Chiu I. M., von Hehn C. A. & Woolf C. J. Neurogenic inflammation and the peripheral nervous system in host defense and immunopathology. Nat Neurosci 15, 1063–1067 (2012). - PMC - PubMed
    1. Ji R. R., Nackley A., Huh Y., Terrando N. & Maixner W. Neuroinflammation and Central Sensitization in Chronic and Widespread Pain. Anesthesiology 129, 343–366 (2018). - PMC - PubMed
    1. Matsuda M., Huh Y. & Ji R. R. Roles of inflammation, neurogenic inflammation, and neuroinflammation in pain. J Anesth 33, 131–139 (2019). - PMC - PubMed

Publication types

LinkOut - more resources