[Preprint]. 2024 Dec 14:2024.12.13.628459.
doi: 10.1101/2024.12.13.628459.

MaAsLin 3: Refining and extending generalized multivariable linear models for meta-omic association discovery

Affiliations

MaAsLin 3: Refining and extending generalized multivariable linear models for meta-omic association discovery

William A Nickols et al. bioRxiv. .

Abstract

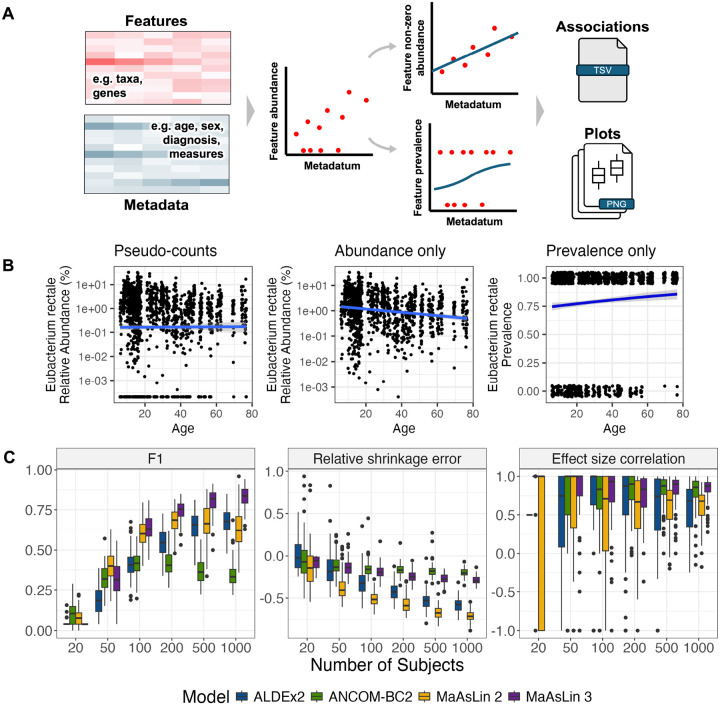
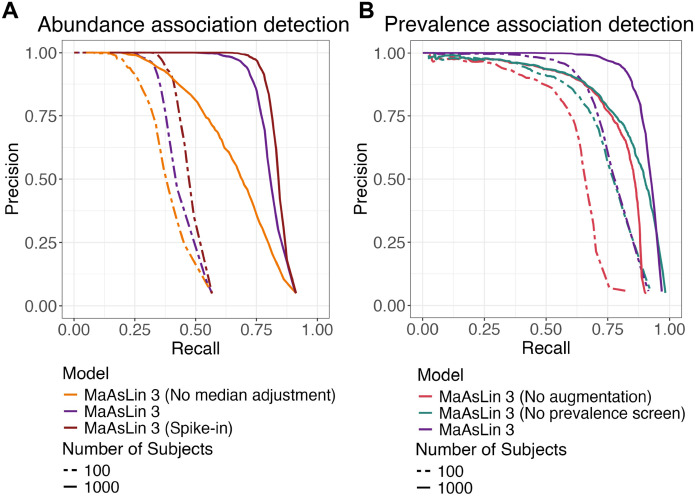
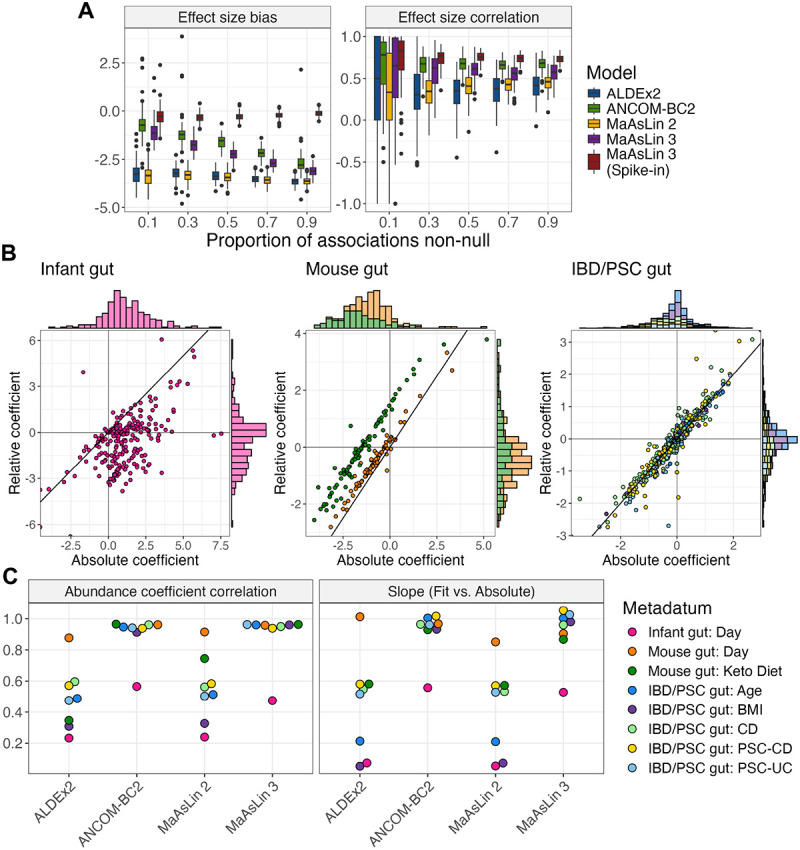
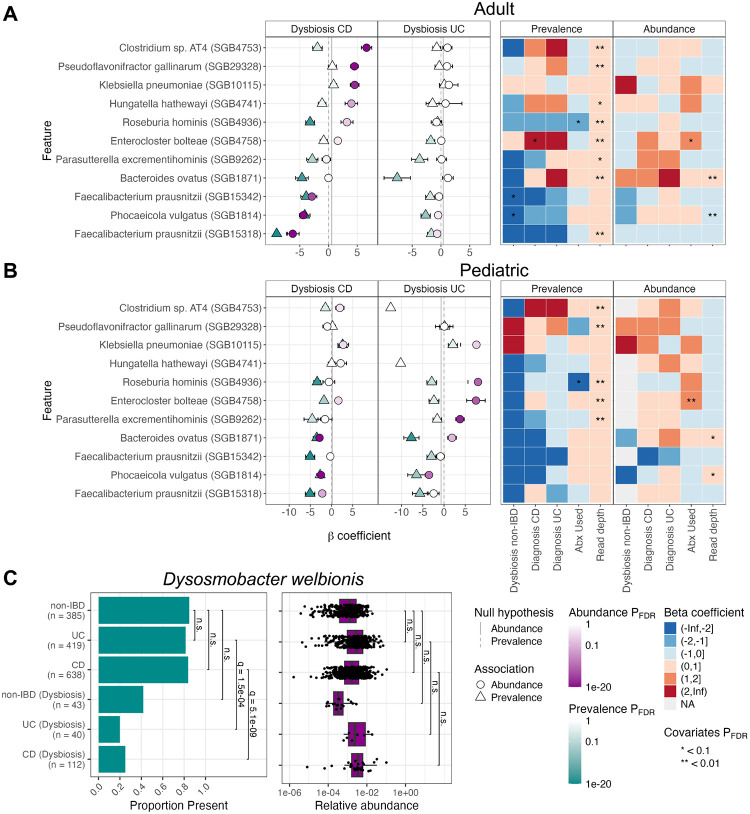
A key question in microbial community analysis is determining which microbial features are associated with community properties such as environmental or health phenotypes. This statistical task is impeded by characteristics of typical microbial community profiling technologies, including sparsity (which can be either technical or biological) and the compositionality imposed by most nucleotide sequencing approaches. Many models have been proposed that focus on how the relative abundance of a feature (e.g. taxon or pathway) relates to one or more covariates. Few of these, however, simultaneously control false discovery rates, achieve reasonable power, incorporate complex modeling terms such as random effects, and also permit assessment of prevalence (presence/absence) associations and absolute abundance associations (when appropriate measurements are available, e.g. qPCR or spike-ins). Here, we introduce MaAsLin 3 (Microbiome Multivariable Associations with Linear Models), a modeling framework that simultaneously identifies both abundance and prevalence relationships in microbiome studies with modern, potentially complex designs. MaAsLin 3 also newly accounts for compositionality with experimental (spike-ins and total microbial load estimation) or computational techniques, and it expands the space of biological hypotheses that can be tested with inference for new covariate types. On a variety of synthetic and real datasets, MaAsLin 3 outperformed current state-of-the-art differential abundance methods in testing and inferring associations from compositional data. When applied to the Inflammatory Bowel Disease Multi-omics Database, MaAsLin 3 corroborated many previously reported microbial associations with the inflammatory bowel diseases, but notably 77% of associations were with feature prevalence rather than abundance. In summary, MaAsLin 3 enables researchers to identify microbiome associations with higher accuracy and more specific association types, especially in complex datasets with multiple covariates and repeated measures.


Conflict of interest statement

Competing interests C.H. declares the following associations: Seres Therapeutics (scientific advisory board, microbiome therapies), Microbiome Insights (scientific advisory board, microbiome data generation), Zoe (scientific advisory board), Empress (scientific advisory board, microbiome therapies).

Figures

Figure 1:
Figure 1:. MaAsLin 3 enables both abundance and prevalence modeling with improved accuracy.
A. MaAsLin 3 model overview. MaAsLin 3 takes as input a table of microbial community feature abundances, as counts or relative abundances, and a corresponding set of metadata (phenotypes, covariates, exposures, etc.). These feature data are normalized, filtered, split into prevalence and log-transformed non-zero abundances, and fit with a modified logistic model or a linear model, respectively. A table of associations is produced indicating the summary statistics corresponding with each feature-metadatum association. B. Using all metagenomes from the HMP2 IBDMDB cohort, Eubacterium rectale shows no association with age when zeros are replaced with pseudo-counts, but it shows a negative non-zero abundance association and a positive prevalence association. C. MaAsLin 3 out-performs other DA methods in simulations. MaAsLin 3 and other common DA methods were run on 100 synthetic log-normal datasets from SparseDOSSA 2. For these simulations, 100 features and 5 metadata were simulated with 10% of the feature-metadatum pairs having true associations with coefficients sampled uniformly from 2.5 to 5, half of which were positive and half of which were negative. Half of the true associations were abundance associations; the rest were prevalence associations. The read depth per sample was drawn from a log-normal distribution with a mean of 50,000 (analogous to the number of informative reads per dataset, such as amplicon sequencing). Significant associations (no model fitting errors, q-value less than 0.1, joint q-value for MaAsLin 3) were considered correct if they matched the true associations in the feature and metadatum. A mismatch in association type—abundance versus prevalence—was allowed for all methods since no method besides MaAsLin 3 reports association type. F1 is the harmonic mean of precision and recall; 1 is optimal. The relative shrinkage error is the difference between the absolute fit and true coefficients divided by the true coefficient, averaged over the significant associations; 0 is optimal. The effect size correlation is the Spearman correlation between the fit and true coefficients per metadatum averaged over the metadata; 1 is optimal. Each point represents a simulated dataset.
Figure 2:
Figure 2:. MaAsLin 3’s default model components improve accuracy beyond simpler regression models.
A. Precision versus recall across a range of q-value thresholds for various MaAsLin 3 abundance modeling options: without a median adjustment for compositionality when only using relative abundance data; MaAsLin 3’s default settings (with the median adjustment when using relative abundance data); and without the median adjustment using data from a (simulated) experimental spike-in procedure. The versions were run on the same 100 synthetic log-normal datasets from SparseDOSSA 2 as in Fig. 1C. Unlike Fig. 1, significant associations (no model fitting errors, individual q-value less than 0.1) were only considered correct if they matched the true associations in the feature, metadatum, and type of association (prevalence/abundance). B. Precision versus recall for MaAsLin 3 prevalence modeling options: without data augmentation to account for separability but with prevalence coefficient screening; without prevalence coefficient screening (allowing any significant prevalence associations) but with data augmentation; and MaAsLin 3’s default setting (with both augmentation and prevalence coefficient screening). The same datasets as in A were used. Curves farther to the right are better.
Figure 3:
Figure 3:. Properties of absolute abundance data that are identifiable on the relative scale are well-identified by MaAsLin 3.
A. All methods show increasing bias but little change in coefficient correlation when relying on relative abundance data in which more features have true positive associations. MaAsLin 3 and other common DA methods were run on 100 synthetic log-normal datasets from SparseDOSSA 2 generated as in Fig. 1C but with 90% of the associations positive and the sample number fixed at 100. The effect size bias is the mean of the fit coefficients minus their true coefficients for true associations; 0 is optimal. The effect size correlation is the Spearman correlation between the fit and true coefficients per metadatum averaged over the metadata; 1 is optimal. Each point represents a simulated dataset. B. Relative and experimentally estimated absolute abundance coefficients agree to varying degrees on three real datasets with experimentally determined (spike-in, digital PCR, or flow cytometry) absolute abundances. MaAsLin 3 was run on both the experimental absolute abundances and on the corresponding relative abundances, and the corresponding coefficients are plotted against each other with one point per feature-metadatum pair. C. MaAsLin 3 and ANCOM-BC2 relative abundance regressions best agree with the experimental absolute abundance regressions. ALDEx2, ANCOM-BC2, MaAsLin 2, and MaAsLin 3 were run on the relative abundances and compared to the experimentally determined absolute abundance associations from MaAsLin 3. For each method, for each metadatum in each dataset, the Spearman correlation between the fit relative abundance coefficients and the experimental absolute abundance coefficients was computed over all features. Similarly, for each method, for each metadatum in each dataset, the per-feature relative abundance coefficients were regressed on the per-feature experimentally estimated absolute abundance coefficient. A correlation of 1 and a slope of 1 are optimal.
Figure 4:
Figure 4:. MaAsLin 3 applied to the HMP2 IBDMDB verifies and extends previous gut microbiome associations with IBD.
The species-level abundances from the HMP2 cohort as determined by MetaPhlAn 4 were regressed in MaAsLin 3 using a model equivalent to that previously published incorporating disease-stratified dysbiosis, disease diagnosis, antibiotic usage, read depth, and a per-participant random intercept in individuals at least 16 years of age (A) or under 16 (B). Both panels show a default MaAsLin 3 output summary figure that has been subset to highlight species associated with either adult or pediatric dysbiosis. The estimated coefficients and their standard errors are represented by points and bars on the left. C. Dysosmobacter welbionis prevalence differed between dysbiosis and non-dysbiosis, while abundance did not differ. Bars show the comparisons evaluated in the MaAsLin 3 model after controlling for the aforementioned covariates and FDR correcting over all associations.

References

    1. Nearing J. T. et al. Microbiome differential abundance methods produce different results across 38 datasets. Nature Communications 13, 342 (2022). - PMC - PubMed
    1. Gloor G. B., Macklaim J. M., Pawlowsky-Glahn V. & Egozcue J. J. Microbiome Datasets Are Compositional: And This Is Not Optional. Frontiers in Microbiology 8, 2224 (2017). - PMC - PubMed
    1. Morton J. T. et al. Establishing microbial composition measurement standards with reference frames. Nature Communications 10, 2719 (2019). - PMC - PubMed
    1. Gloor G. B., Wu J. R., Pawlowsky-Glahn V. & Egozcue J. J. It’s all relative: analyzing microbiome data as compositions. Annals of Epidemiology 26, 322–329 (2016). - PubMed
    1. Ma S. et al. A statistical model for describing and simulating microbial community profiles. PLoS computational biology 17, e1008913 (2021). - PMC - PubMed

Publication types

LinkOut - more resources