

Design, Characterization, and Evaluation of Textile Systems and Coatings for Sports Use: Applications in the Design of High-Thermal Comfort Wearables
- PMID: 39713610
- PMCID: PMC11656360
- DOI: 10.1021/acsomega.4c05600
Design, Characterization, and Evaluation of Textile Systems and Coatings for Sports Use: Applications in the Design of High-Thermal Comfort Wearables
Abstract
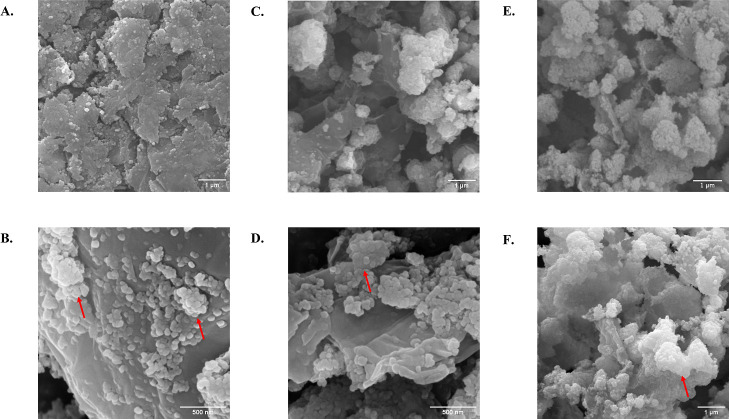
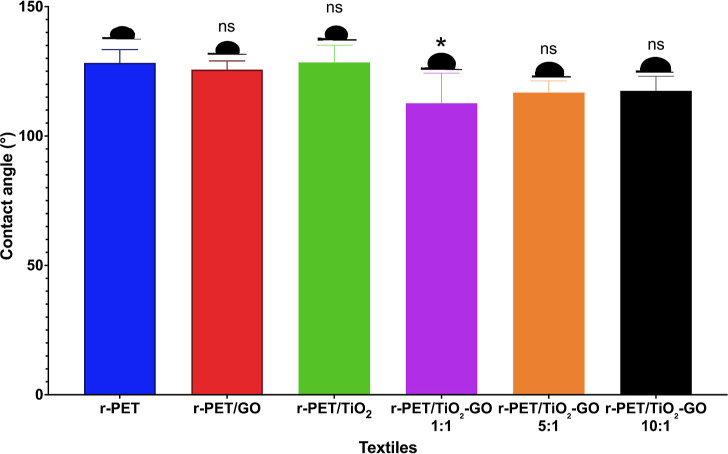
Exposure to high temperatures during indoor and outdoor activities increases the risk of heat-related illness such as cramps, rashes, and heatstroke (HS). Fatal cases of HS are ten times more common than serious cardiac episodes in sporting scenarios, with untreated cases leading to mortality rates as high as 80%. Enhancing thermal comfort can be achieved through heat loss in enclosed spaces and the human body, utilizing heat transfer mechanisms such as radiation, conduction, convection, and evaporation, which do not require initial energy input. Among these, two primary mechanisms are commonly employed in the textile industry to enhance passive cooling: radiation and conduction. The radiation approach encompasses two aspects: (1) reflecting solar spectrum (SS) wavelengths and (2) transmitting and emitting in the atmospheric window (AW). Conduction involves dissipating heat through materials with a high thermal conductivity. Our study focuses on the combined effect of these radiative and conductive approaches to increase thermal energy loss, an area that has not been extensively studied to date. Therefore, the main objective of this project is to develop, characterize, and evaluate a nanocomposite polymeric textile system using electrospinning, incorporating graphene oxide (GO) nanosheets and titanium dioxide nanoparticles (TiO2 NPs) within a recycled polyethylene terephthalate (r-PET) matrix to improve thermal comfort through the dissipation of thermal energy by radiation and conduction. The textile system with a 5:1 molar ratio between TiO2 NPs and GO demonstrates 89.26% reflectance in the SS and 98.40% transmittance/emittance in the AW, correlating to superior cooling performance, with temperatures 20.06 and 1.27 °C lower than skin temperatures outdoors and indoors, respectively. Additionally, the textile exhibits a high thermal conductivity index of 0.66 W/m K, contact angles greater than 120°, and cell viability exceeding 80%. These findings highlight the potential of the engineered textiles in developing high-performance sports cooling fabrics, providing significant advancements in thermal comfort and safety for athletes.
© 2024 The Authors. Published by American Chemical Society.
Conflict of interest statement
The authors declare no competing financial interest.
Figures


Similar articles
-
Highly Sunlight Reflective and Infrared Semi-Transparent Nanomesh Textiles.ACS Nano. 2021 Oct 26;15(10):15962-15971. doi: 10.1021/acsnano.1c04104. Epub 2021 Oct 18. ACS Nano. 2021. PMID: 34661392
-
Spectrally Selective Nanocomposite Textile for Outdoor Personal Cooling.Adv Mater. 2018 Aug;30(35):e1802152. doi: 10.1002/adma.201802152. Epub 2018 Jul 17. Adv Mater. 2018. PMID: 30015999
-
A Janus Textile Capable of Radiative Subambient Cooling and Warming for Multi-Scenario Personal Thermal Management.Small. 2023 May;19(19):e2206149. doi: 10.1002/smll.202206149. Epub 2023 Feb 19. Small. 2023. PMID: 36807770
-
Improving thermal conductivities of textile materials by nanohybrid approaches.iScience. 2022 Jan 30;25(3):103825. doi: 10.1016/j.isci.2022.103825. eCollection 2022 Mar 18. iScience. 2022. PMID: 35243220 Free PMC article. Review.
-
Personal Thermal Management by Radiative Cooling and Heating.Nanomicro Lett. 2024 Mar 13;16(1):153. doi: 10.1007/s40820-024-01360-1. Nanomicro Lett. 2024. PMID: 38478150 Free PMC article. Review.
Cited by
-
Machine Learning in Polymeric Technical Textiles: A Review.Polymers (Basel). 2025 Apr 25;17(9):1172. doi: 10.3390/polym17091172. Polymers (Basel). 2025. PMID: 40362956 Free PMC article. Review.
-
A mathematical phase field model predicts superparamagnetic nanoparticle accelerated fusion of HeLa spheroids for field guided biofabrication.Sci Rep. 2025 Jun 5;15(1):19765. doi: 10.1038/s41598-025-04495-2. Sci Rep. 2025. PMID: 40473770 Free PMC article.
References
-
- Puley G.Extreme Heat: Preparing for the Heat Waves of the Future: New York, 2022.
-
- Odonkor S. T.; Adams S. Climate Change-Mediated Heat Stress Vulnerability and Adaptation Strategies among Outdoor Workers. Clim. Dev. 2022, 14 (7), 591–599. 10.1080/17565529.2021.1954867. - DOI
-
- Yi F.; Zhou T.; Yu L.; McCarl B.; Wang Y.; Jiang F.; Wang Y. Outdoor Heat Stress and Cognition: Effects on Those over 40 Years Old in China. Weather Clim. Extrem. 2021, 32, 100308.10.1016/j.wace.2021.100308. - DOI
-
- Hollander K.; Klöwer M.; Richardson A.; Navarro L.; Racinais S.; Scheer V.; Murray A.; Branco P.; Timpka T.; Junge A.; Edouard P. Apparent Temperature and Heat-related Illnesses during International Athletic Championships: A Prospective Cohort Study. Scand. J. Med. Sci. Sports 2021, 31 (11), 2092–2102. 10.1111/sms.14029. - DOI - PubMed
-
- Yeargin S. W.; Dompier T. P.; Casa D. J.; Hirschhorn R. M.; Kerr Z. Y. Epidemiology of Exertional Heat Illnesses in National Collegiate Athletic Association Athletes During the 2009–2010 Through 2014–2015 Academic Years. J. Athl. Train. 2019, 54 (1), 55–63. 10.4085/1062-6050-504-17. - DOI - PMC - PubMed
LinkOut - more resources
Full Text Sources