

In Silico Modeling and Characterization of Epstein-Barr Virus Latent Membrane Protein 1 Protein
- PMID: 39713625
- PMCID: PMC11656244
- DOI: 10.1021/acsomega.4c06868
In Silico Modeling and Characterization of Epstein-Barr Virus Latent Membrane Protein 1 Protein
Abstract
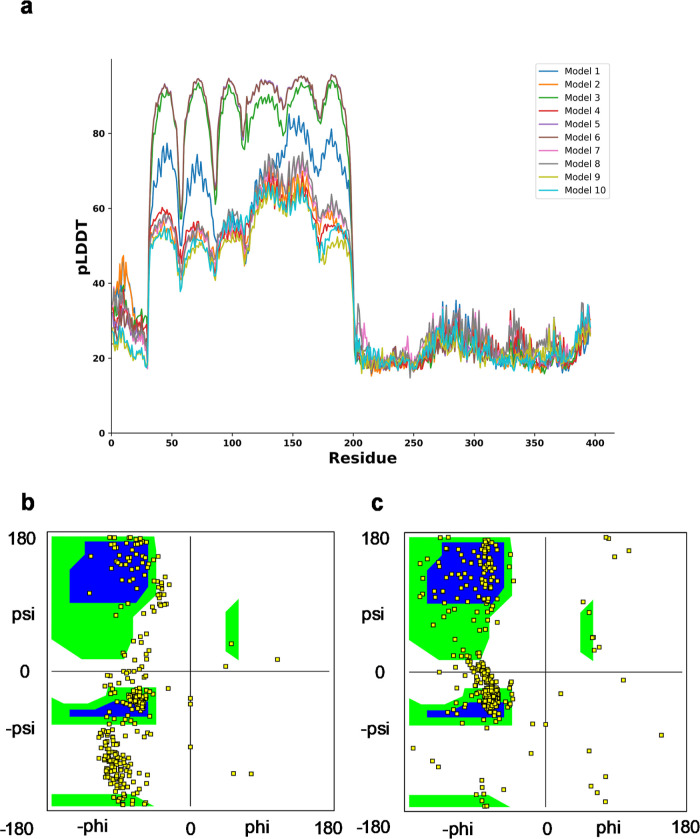
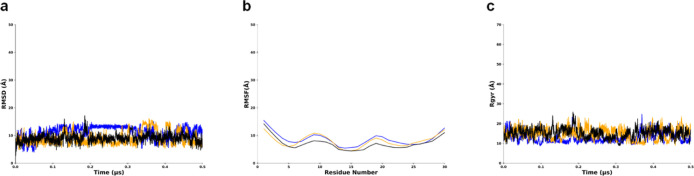
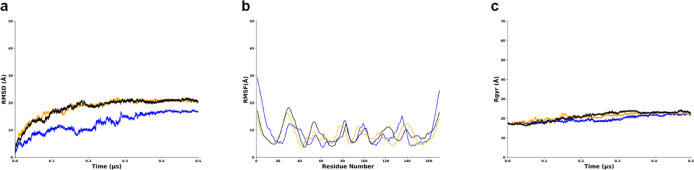
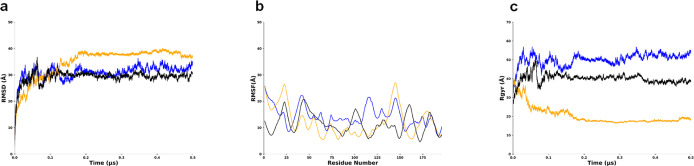
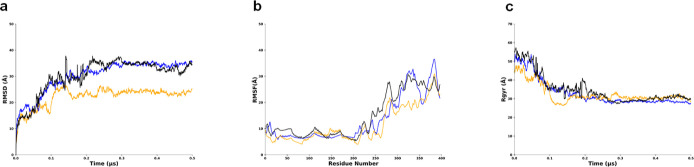
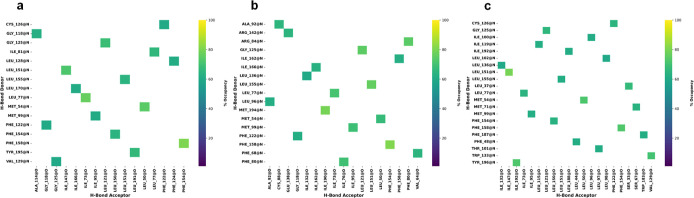
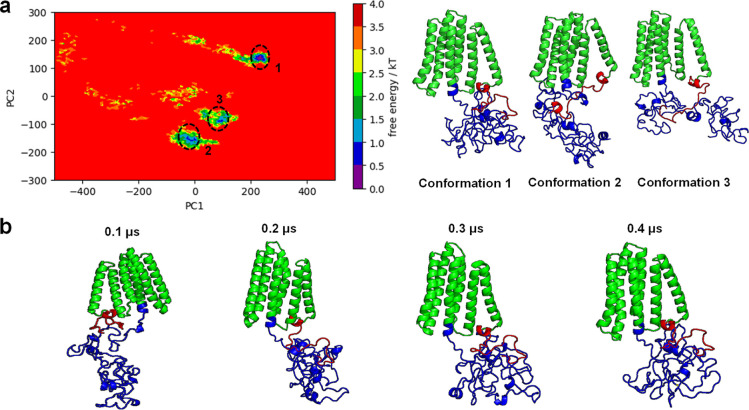
Latent membrane protein 1 (LMP1) plays a crucial role in Epstein-Barr virus (EBV)'s ability to establish latency and is involved in developing and progressing EBV-associated cancers. Additionally, EBV-infected cells affect the immune responses, making it challenging for the immune system to eliminate them. Due to the aforementioned reasons, it is crucial to understand the structural features of LMP1, which are essential for the development of novel cancer therapies that target its signaling pathways. To date, there is yet to be a complete LMP1 protein structure; therefore, in our work, we modeled the full-length LMP1 containing the short cytoplasmic N-terminus, six transmembrane domains (TMDs), and a long-simulated C-terminus. Our model showed good stability and protein compactness evaluated through accelerated-molecular dynamics, where the conformational ensemble exhibited compact folds, particularly in the TMDs. Our results suggest that specific domains or motifs, predominantly in the C-terminal domain of LMP1, show promise as potential drug targets. As a whole, our work provides insights into key structural features of LMP1 that will allow the development of novel LMP1 therapies.
© 2024 The Authors. Published by American Chemical Society.
Conflict of interest statement
The authors declare no competing financial interest.
Figures
Similar articles
-
Identification of Host Biomarkers of Epstein-Barr Virus Latency IIb and Latency III.mBio. 2019 Jul 2;10(4):e01006-19. doi: 10.1128/mBio.01006-19. mBio. 2019. PMID: 31266868 Free PMC article.
-
LMP1-Induced Sumoylation Influences the Maintenance of Epstein-Barr Virus Latency through KAP1.J Virol. 2015 Aug;89(15):7465-77. doi: 10.1128/JVI.00711-15. Epub 2015 May 6. J Virol. 2015. PMID: 25948750 Free PMC article.
-
Latent Membrane Protein 1 Is a Novel Determinant of Epstein-Barr Virus Genome Persistence and Reactivation.mSphere. 2017 Nov 8;2(6):e00453-17. doi: 10.1128/mSphereDirect.00453-17. eCollection 2017 Nov-Dec. mSphere. 2017. PMID: 29134204 Free PMC article.
-
The Role of LMP1 in Epstein-Barr Virus-associated Gastric Cancer.Curr Cancer Drug Targets. 2024;24(2):127-141. doi: 10.2174/1568009623666230512153741. Curr Cancer Drug Targets. 2024. PMID: 37183458 Review.
-
Insights into intricacies of the Latent Membrane Protein-1 (LMP-1) in EBV-associated cancers.Life Sci. 2023 Jan 15;313:121261. doi: 10.1016/j.lfs.2022.121261. Epub 2022 Dec 7. Life Sci. 2023. PMID: 36493876 Review.
References
-
- de-Thé G.; Day N. E.; Geser A.; Lavoué M. F.; Ho J. H.; Simons M. J.; Sohier R.; Tukei P.; Vonka V.; Zavadova H. Sero-epidemiology of the Epstein-Barr virus: preliminary analysis of an international study – a review. IARC Sci. Publ. 1975, (11 Pt 2), 3–16. - PubMed
-
- Eliopoulos A. G.; Blake S. M.; Floettmann J. E.; Rowe M.; Young L. S. Epstein-Barr virus-encoded latent membrane protein 1 activates the JNK pathway through its extreme C terminus via a mechanism involving TRADD and TRAF2. J. Virol. 1999, 73 (2), 1023–1035. 10.1128/JVI.73.2.1023-1035.1999. - DOI - PMC - PubMed
LinkOut - more resources
Full Text Sources
Research Materials