. 2025 Feb;21(2):e14417.
doi: 10.1002/alz.14417. Epub 2024 Dec 23.

Stabilization of mitochondria-associated endoplasmic reticulum membranes regulates Aβ generation in a three-dimensional neural model of Alzheimer's disease

Affiliations

Stabilization of mitochondria-associated endoplasmic reticulum membranes regulates Aβ generation in a three-dimensional neural model of Alzheimer's disease

Jacob C Zellmer et al. Alzheimers Dement. 2025 Feb.

Abstract

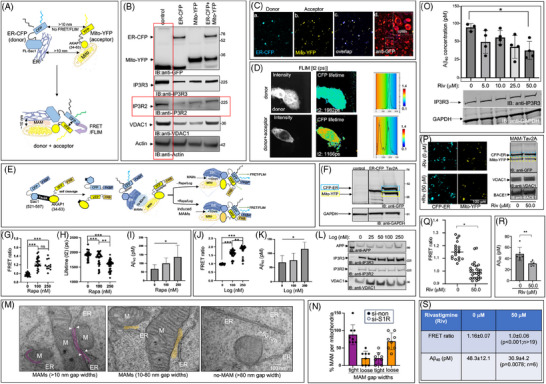
Introduction: We previously demonstrated that regulating mitochondria-associated endoplasmic reticulum (ER) membranes (MAMs) affects axonal Aβ generation in a well-characterized three-dimensional (3D) neural Alzheimer's disease (AD) model. MAMs vary in thickness and length, impacting their functions. Here, we examined the effect of MAM thickness on Aβ in our 3D neural model of AD.

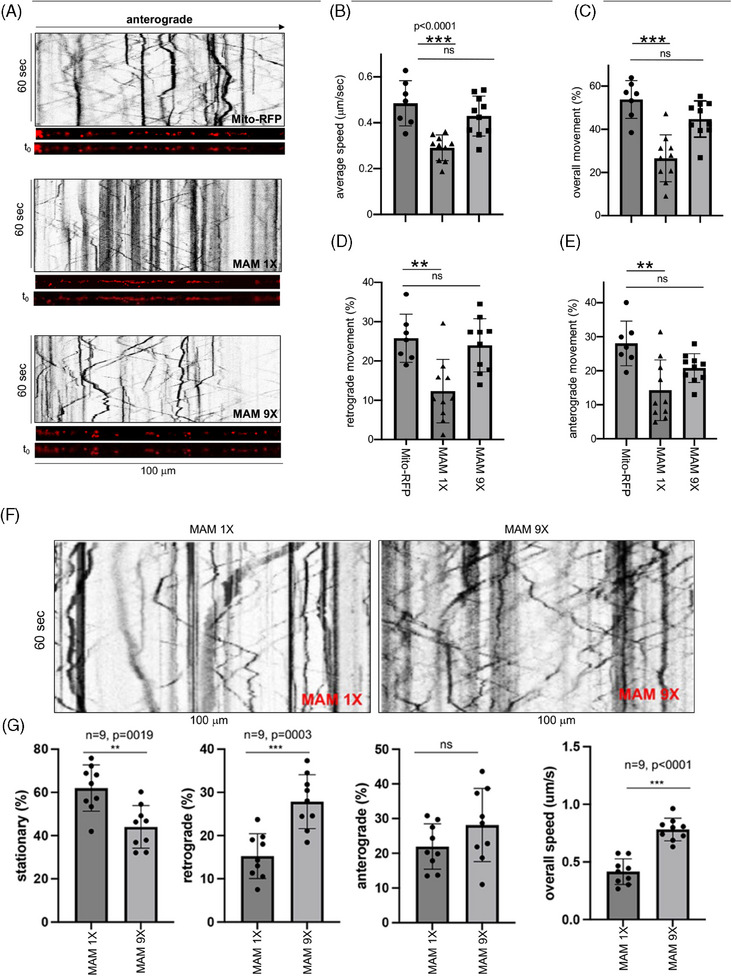
Methods: We employed fluorescence resonance energy transfer (FRET) or fluorescence-based MAM stabilizers, electron microscopy, Aβ enzyme-linked immunosorbent assay (ELISA), and live-cell imaging with kymography to assess how stabilizing MAMs of different gap widths influence Aβ production and MAM axonal mobility.

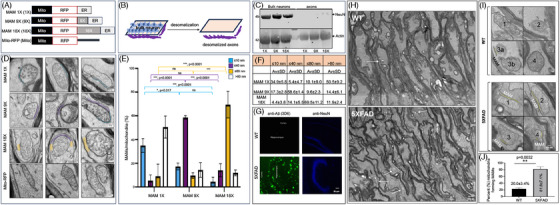
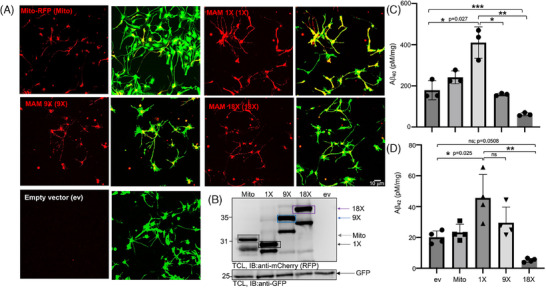
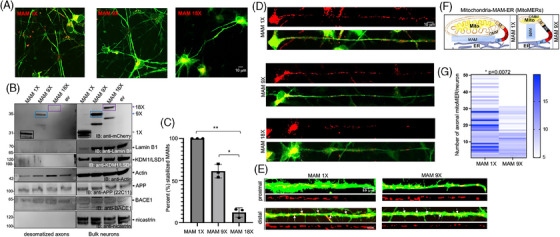
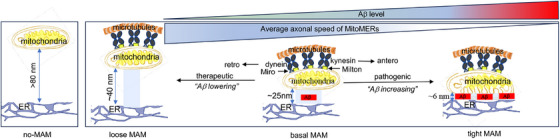
Results: Stabilizing tight MAMs (∼6 nm gap width) significantly increased Aβ levels, whereas basal (∼25 nm) and loose MAMs (∼40 nm) maintained or reduced Aβ levels, respectively. Tight MAMs reduced mitochondrial axonal velocity compared to basal MAMs, while loose MAMs showed severely reduced axonal distribution.

Discussion: Our findings suggest that stabilizing MAMs of specific gap widths, particularly in axons, without complete destabilization could be an effective therapeutic strategy for AD.

Highlights: The stabilization of MAMs exacerbates or ameliorates Aβ generation from AD neurons in a MAM gap width-dependent manner. A specific stabilization threshold within the MAM gap width spectrum shifts the amyloidogenic process to non-amyloidogenic. Tight MAMs slow down mitochondrial axonal transport compared to lose MAMs offering a quantitative method for measuring MAM stabilization.

Keywords: Alzheimer's disease; amyloid β; endoplasmic reticulum; mitochondria; mitochondria‐associated ER membranes; β‐amyloid precursor protein; β‐site APP cleaving enzyme.


Conflict of interest statement

All authors report no conflict of interest. Author disclosures are available in the Supporting Information.

Figures

FIGURE 1
FIGURE 1
Tightening MAM gap widths increased Aβ generation in a dose‐dependent manner in vitro. (A) Schematic of FRET biosensors ER‐CFP and Mito‐YFP that generates FRET signals from tight MAMs of ≤ 10 nm gap widths. (B) Representative immunoblot of N2AAPP expressing the biosensors individually (ER‐CFP or Mito‐YFP) or dually (ER‐CFP + Mito‐YFP). IP3R3 and ACAT1 serve as MAM markers. (C) Direct immunofluorescence (IF) images of cells co‐expressing the donor (ER‐CFP) and the acceptor (Mito‐YFP) (a, b, and c) and indirect IF (iIF) of the cells probed with anti‐GFP antibody that detects both CFP and YFP (d). (D) Representative FLIM analyses measuring the donor lifetime (t2) of cells expressing ER‐CFP (donor) or ER‐CFP+Mito‐YFP (donor+acceptor). (E) Schematic of the inducible MAM stabilizer CFP‐FRB‐ER‐Tav2A‐Mito‐FKBP‐YFP (MAM‐Tav2A) that undergoes self‐cleavage generating equimolar levels of the donor (CFP‐FRB‐ER or ER‐CFP) and the acceptor (Mito‐FKBP‐YFP or Mito‐YFP), and promote FRET/FLIM when attached to the endogenous tight MAMs or upon enhancing the tight MAM formation by inducing the FRB and FKBP interaction with rapamycin (Rapa) or its analog Rapalog (Log). (F) IB of cells expressing MAM‐Tav2A (Tav2A) showing equimolar expression of the CFP‐ER (blue box) and Mito‐YFP (yellow box) after the self‐cleavage of Tav2A. (G, H) FRET (G) and FLIM (H) analysis after rapamycin (Rapa) treatment. FRET values are presented as ratios of intensities between channel 2 (465–500 nm) and channel 1 (525–555 nm). The FLIM (t2) values are presented as donor lifetimes (t2) in pico‐seconds (ps). Forty to 50 cells were randomly selected to generate ROIs on a cell‐by‐cell basis. One‐way ANOVA. *** p < 0.0001. (I) Aβ‐ELISA (WACO) assays detecting Aβ40 levels in the CM of FACS‐enriched N2AAPP cells expressing MAM‐Tav2A after treatment with increasing concentrations of rapamycin (Rapa). One‐way ANOVA. n = 3 experiments, sample size ≥ 3. *p ≤ 0.05. Aβ was normalized to the corresponding Rapa or Log treatment by subtracting the value from non‐transfected N2AAPP cells. (J, K) FRET ratio (J) and Aβ40 levels (K) after rapalog (Log) treatment. (L) Representative Western blot of Log‐treated cells showing little or no impact on the levels of APP and the indicated MAM‐proteins. (M) TEM images showing ER (ER)‐mitochondria (M) contact sites or MAMs of gap widths < 10 nm (purple) or > 10 nm (orange) in ReN‐GA cells electroporated with si‐non or si‐S1R for 48 h. Mitochondria separated by > 80 nm from the ER are non‐MAMs. (N) Quantitation of the tight (< 10 nm) or loose (> 10 nm) MAMs in control (si‐non) and S1R‐silenced (si‐S1R) cells per mitochondria per frame (MAM per M). More than seven frames were used for each analysis. An average of 3–6 mitochondria forming tight or loose MAMs from each frame were manually counted (unbiased, *, p < 0.05; **, p < 0.001). (O) Aβ ELISA assay of 14‐day 3D‐differentiated ReN‐GA cells after 3‐day rivastigmine (Riv) treatment (once every day). n = 4, three independent experiments. One‐way ANOVA. *, p < 0.05. (P) Representative confocal (left) and Western blot (right) images of MAM‐Tav2A‐expressing N2AAPP cells after 24‐h treatment with Riv (0 or 50 µM). MAM‐Tav2A generated equimolar levels of the donor (CFP‐ER) and acceptor (Mito‐YFP). (Q) Quantitation of the FRET ratio between the donor and the acceptor of vehicle‐ (0 µM) or Riv‐treated (50 µM) MAM‐Tav2A‐expressing N2AAPP cells. (R) Aβ ELISA (Wako) of CM of vehicle‐treated (0 µM) or Riv‐treated (50 µM) cells showed a significant reduction of Aβ40 (pM) levels after 50 µM Riv‐treatment. n = 6, p < 0.001. (S) FRET (ratio) and Aβ (pM) values are tabulated. APP, amyloid precursor protein; CFP, cyan fluorescence protein; CM, conditioned media; ELISA, enzyme‐linked immunosorbent assay; ER, endoplasmic reticulum; FKBP, FK506‐binding protein; FRB, FK506 rapamycin binding; FRET, Fluorescence resonance energy transfer; GFP, green fluorescence protein; MAM, mitochondria‐associated ER membrane; TEM, transmission electron microscopy; YFP, yellow fluorescence protein.
FIGURE 2
FIGURE 2
The constitutive MAM stabilizers MAM 1X, MAM 9X, and MAM 18X increased the amounts of tight, basal, and loose MAMs in the axons. (A) Schematics of the constitutive MAM stabilizers MAM 1X (1X), MAM 9X (9X), and MAM 18X (18X) generated by fusing the mitochondrial targeting sequence of AKAP1 (34–63) (Mito) with the ER‐targeting sequence of Ubc6 (283–303) (ER) with RFP. Mito‐RFP (Mito) represents the Mito conjugated with RFP. Mito‐RFP contains a scrambled peptide (black line) (DLELKLRILQSTVPRARDPPVAT) to mimic the length of Ubc6 (283‐303) in the MAM stabilizers. (B) Schematic of the desomatization process of ReN‐GA cells seeded on membrane inserts with 0.3 µm2 pores and differentiated for 7–12 days before isolating the bulk neurons and desomatizing the anucleated axons. Bulk neurons were isolated by scraping the cells from the upper side of the insert. To obtain pure axons, the bulk neurons on the upper side were scraped with a cotton tip applicator, which created desomatized axons on the opposite side. (C) Western blot of protein extracts from bulk neurons and purified anucleated desomatized axons from 10–14 days differentiated ReN‐GA cells probed with antibodies against the nuclear protein NeuN (anti‐NeuN) or with anti‐Actin antibody. NeuN was largely absent in the desomatized axons, confirming the isolation of pure desomatized anucleated axons. (D) Representative EM images (triplicates) of axons from MAM 1X, MAM 9X, MAM 18X, or Mito‐RFP expressing 12‐day differentiated ReN‐GA neurons. MAMs of ≤ 10 nm (blue), ≤ 40 nm (purple), or ≤ 80 nm (orange) were identified (manually, unbiased) per mitochondria. (E) Quantitative analysis of the number of MAMs of gap widths ≤ 10 nm, ≤ 40 nm, or ≤ 80 nm or non‐MAMs (> 80 nm gap width) per mitochondria per frame. More than four frames were used for each analysis. An average of 3–6 mitochondria forming or not forming MAMs from each frame was manually counted (unbiased, *, p < 0.05; ***, p < 0.0001). (F) Table recording the average (Av) number of ≤ 10 nm, ≤ 40 nm, ≤ 80 nm or > 80 nm gap widths per mitochondria per frame. (G) Representative confocal images of the WT and 5XFAD mouse brain sections immunostained with anti‐Aβ antibody (3D6) and anti‐NeuN. (H) Representative 5000X magnified TEM images of the WT and 5XFAD mouse optic nerve axons. Arrows indicate mitochondria forming MAMs. (I) Four representative 25000X magnified images from the 5000X magnified images of each genotype (WT and 5XFAD). The 25000X magnified images were used to assess the number of MAMs (yellow areas juxtaposed between the ER and mitochondria). (J) Quantitation of the percentage of mitochondria forming MAMs inside the optic nerve axons of the WT and 5XFAD mice. More than four frames were used for each analysis. Total and MAM‐forming mitochondria from each image were manually counted (unbiased, ** p = 0.0032). EM, electron microscopy; ER, endoplasmic reticulum; FAD, familial Alzheimer's disease; MAM, mitochondria‐associated ER membrane; SD, standard deviation; TEM, transmission electron microscopy; WT, wild‐type.
FIGURE 3
FIGURE 3
MAM stabilization increased Aβ generation in a 3D neural cell culture model of AD. (A) Representative confocal images of 12‐day 3D differentiated ReN‐GA cells expressing Mito‐RFP, MAM 1X, MAM 9X, MAM 18X, or ev. Punctate labeling of Mito‐RFP, MAM 1X, and MAM 9X was detected in the soma and neuronal processes or axons (red). (B) Representative immunoblot image of the expression levels of Mito‐RFP (gray box), MAM 1X (black box), MAM 9X (blue box), or MAM 18X (purple box). (C, D) SDS‐soluble Aβ40 (C) and Aβ42 (D) were collected from the 3D matrix and measured via MSD ELISA. One‐way ANOVA was performed; n = 3 experiments (sample size ≥ 3). *, p < 0.05. The significance of the differences was evaluated against untransfected (control) ReN‐GA cells. AD, Alzheimer's disease; ELISA, enzyme‐linked immunosorbent assay; ev, empty vector; MAM, mitochondria‐associated ER membrane.
FIGURE 4
FIGURE 4
The stabilization of tight MAMs increased their axonal distribution compared to loose MAMs in ReN‐GA neurons. (A) Representative confocal images of 3D differentiated ReN‐GA neurons expressing MAM 1X, MAM 9X, or MAM 18X (red). ReN‐GA cells express GFP (green). (B) IB of protein extracts from bulk neurons and purified anucleated desomatized axons from 12‐day differentiated ReN‐GA cells expressing MAM 1X, MAM 9X, or MAM 18X probed with antibodies against mCherry (anti‐mCherry) that detected MAM 1X, 9X, and 18X‐tagged MAMs of three different gap widths. Dramatically increased levels of MAM 1X were detected in the desomatized axons compared to MAM 9X in the desomatized axons. The axonal levels of MAM 18X were severely reduced in desomatized axons. The nuclear membrane protein Lamin B1 (anti‐Lamin B1) or KDM1/LSD1 (anti‐KDM1/LSD1) were absent in the desomatized axons, confirming their purity. Actin levels remained equal. APP [anti‐APP (22C11)] and BACE1 (anti‐BACE1) levels remained equal in both desomatized axons and Bulk neurons from ReN‐GA expressing MAM 1X, 9X, or 18X. (C) Quantitation of the levels (%) of MAM 1X, MAM 9X, and MAM 18X in axons versus bulk neurons. n = 3, *, p < 0.05; **, p < 0.001. (D) Confocal images of single ReN‐GA neurons (green) expressing the RFP‐labeled stabilizers (red puncta). (E) Schematics of mitoMERs formed by MAM 1X or MAM 9X. (F) Representative axonal segments (∼100 µm) of proximal (close to the soma) or distal (close to the terminals) areas of axons. The green channel (GFP) was overexposed to show the axonal structures. The white arrows indicate the mitoMER organelles in the axons. The red puncta represent MAM 1X or MAM 9X‐labeled mitoMERs in axons. (G) Quantitative heatmap of the distribution of mitoMER organelles in axons labeled with MAM 1X or MAM 9X. Two‐way ANOVA. **, p < 0.001. Number of neurons (n) ≥ 5 from each experiment (triplicate experiments). The blue shading indicates the number of MAMs of a specific size per 100 µm axon. APP, amyloid precursor protein; GFP, green fluorescence protein; MAM, mitochondria‐associated ER membrane.
FIGURE 5
FIGURE 5
The stabilization of tight MAMs reduced their axonal mobility compared to free or loose MAMs in 3D‐differentiated ReN‐GA‐AD neurons. (A) Representative kymographs of axonal movement (stationary, retrograde, and anterograde) of Mito‐RFP, MAM 1X, and MAM 9X in axons of 12‐day differentiated ReN‐GA cells. ImageJ straightened live imaging videos (12 frames per second) and corresponding single‐frame images of the axons are presented under each kymograph. (B–E) Quantitative analysis of the overall speed (B) and percentage (%) of axonal movement (overall [C], retrograde [D], and anterograde [E]) of Mito‐RFP, MAM 1X and MAM 9X. (F, G) The kymographs (F) and the quantitative values (G) of the percent axonal movement and speed of the MitoMERs stabilized by MAM 1X or MAM 9X in 12‐day differentiated naïve ReN‐G neurons. The data are presented per 100 µm per 60 s. One‐way ANOVA. ***p < 0.0005, **p < 0.005. AD, Alzheimer's disease; ANOVA, analysis of variance; MAM, mitochondria‐associated ER membrane.
FIGURE 6
FIGURE 6
Schematic representation of MAM gap widths increasing or decreasing Aβ generation from AD neurons. Mitochondria and the ER separated by a distance > 80 nm do not form MAMs (no‐MAMs). The MAM gap width ranges from the tight (∼6 nm) to the loose (∼80 nm) with intermediates (10–80 nm). Most MAMs in the basal level are ∼25 nm thick (gap width). In the neurons expressing APP carrying FAD mutations, Aβ is generated in the MAMs at a basal level. “Tightening” the MAM gap width (vertical) increases the length (horizontal), resulting in an increased area between the ER and mitochondria to exacerbate the Aβ generation in the MAMs via yet unknown mechanisms. “Loosening” MAMs by increasing the vertical gap widths decreases the horizontal length and reduces Aβ generation. ER binding via MAMs counteracts the mitochondria's anterograde (antero) or retrograde (retro) drag on the microtubules exerted by myosin or kinesin, respectively, via the Miro/Milton complex in axons. The “tightening” of the MAMs increases the microtubule drag on mitochondria and lowers their axonal mobility. In contrast, “loosening” the MAMs restores mitochondria's axonal mobility. An effective modulator that may regulate MAM stabilization by “loosening” but not disrupting MAMs may switch “Aβ‐generating” pathogenic MAMs to “Aβ‐lowering” therapeutic MAMs by crossing the threshold of Aβ “maintaining” or “neutral” MAMs. The dose and effectiveness of the “Aβ‐lowering” MAM modulators can be determined by measuring the axonal mobility of the ER‐fused mitochondria (MitoMERs) after treating our 3D neural model of AD with potential MAM modulators. 3D, three‐dimensional; AD, Alzheimer's disease; APP, amyloid precursor protein; ER, endoplasmic reticulum; FAD, familial AD; MAM, Mitochondria‐associated ER membrane.

Similar articles

Cited by

References

    1. Schon EA, Area‐Gomez E. Mitochondria‐associated ER membranes in Alzheimer disease. Mol Cell Neurosci. 2013;55:26‐36. doi:10.1016/j.mcn.2012.07.011 - DOI - PubMed
    1. Erpapazoglou Z, Mouton‐Liger F, Corti O. From dysfunctional endoplasmic reticulum‐mitochondria coupling to neurodegeneration. Neurochem Int. 2017;109:171‐183. doi:10.1016/j.neuint.2017.03.021 - DOI - PubMed
    1. Vrijsen S, Vrancx C, Del Vecchio M, et al. Inter‐organellar communication in Parkinson's and Alzheimer's disease: looking beyond endoplasmic reticulum‐mitochondria contact sites. Front Neurosci. 2022;16:900338. doi:10.3389/fnins.2022.900338 - DOI - PMC - PubMed
    1. Area‐Gomez E, Schon EA. On the pathogenesis of Alzheimer's disease: the MAM hypothesis. FASEB J. 2017;31(3):864‐867. doi:10.1096/fj.201601309 - DOI - PMC - PubMed
    1. Fujimoto M, Hayashi T. New insights into the role of mitochondria‐associated endoplasmic reticulum membrane. Int Rev Cell Mol Biol. 2011;292:73‐117. doi:10.1016/B978-0-12-386033-0.00002-5 - DOI - PubMed

MeSH terms

Substances