. 2025 Feb;21(2):e14418.
doi: 10.1002/alz.14418. Epub 2024 Dec 23.

Microglia internalize tau monomers and fibrils using distinct receptors but similar mechanisms

Affiliations

Microglia internalize tau monomers and fibrils using distinct receptors but similar mechanisms

Kristian F Falkon et al. Alzheimers Dement. 2025 Feb.

Abstract

Introduction: Alzheimer's disease (AD) and other tauopathies are characterized by intracellular aggregates of microtubule-associated protein tau that are actively released and promote proteopathic spread. Microglia engulf pathological proteins, but how they endocytose tau is unknown.

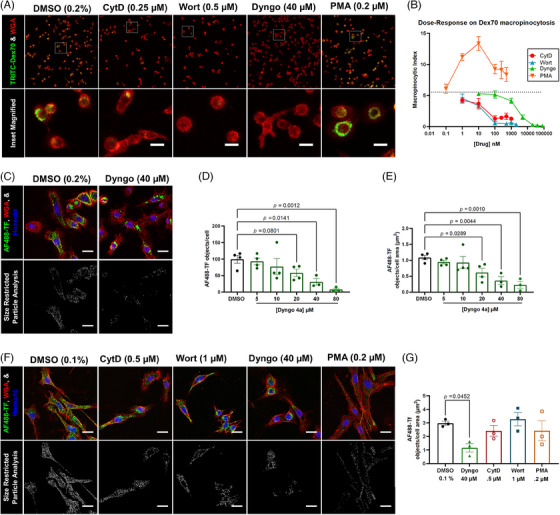
Methods: We measured endocytosis of different tau species by microglia after pharmacological modulation of macropinocytosis or clathrin-mediated endocytosis (CME) or antagonism/genetic depletion of known tau receptors heparan-sulfate proteoglycans (HSPGs) and low-density lipoprotein receptor-related protein 1 (LRP1).

Results: Dynamin inhibition decreased microglial endocytosis of all tested tau species. Meanwhile, HSPG antagonism blocked only fibril uptake, and LRP1 antagonism or genetic depletion inconsistently inhibited the endocytosis of fibrils and monomers. Cre recombinase robustly enhanced tau uptake with partial selectivity for fibrils.

Discussion: These data show that microglia take up both tau monomers and aggregates via a dynamin-dependent form of endocytosis (eg, CME) but may differ in using HSPGs for entry depending on species.

Highlights: Microglial endocytosis of tau monomers and fibrils is dynamin-dependent. HSPG antagonism blocks microglial uptake of tau fibrils but not monomers. LRP1 antagonism or knockdown inconsistently inhibits tau uptake. TAT-Cre stimulates semi-selective uptake of fibrils over monomers.

Keywords: Alzheimer's disease; endocytosis; microglia; neuroinflammation; tau; tauopathy.


Conflict of interest statement

Ariel Louwrier is the founder of StressMarq Biosciences, who provided recombinant tau for use in this study, and Jacob A. McPhail was employed by StressMarq Biosciences during the time the work was performed. The authors declare that they have no other competing interests. Author disclosures are available in the Supporting Information.

Figures

FIGURE 1
FIGURE 1
Known mechanisms of tau endocytosis. Others have shown that tau can be internalized via two endocytic routes: (A) binding LRP1 (facilitated by HSPG molecular bridging) and recruiting clathrin, dynamin, and other associated proteins (not shown) for internalization via CME; (B) binding HSPG and inducing macropinocytosis, which is dependent on actin, PI3K, and PKC. CME, clathrin‐mediated endocytosis; HSPG, heparan‐sulfate proteoglycans; LRP1, lipoprotein receptor‐related protein 1; PI3K, phosphoinositide 3‐kinase; PKC, protein kinase C.
FIGURE 2
FIGURE 2
In BV2 microglia, PKC inducer (PMA), actin inhibitor (cytochalasin D), and PI3K inhibitor (wortmannin) modulate macropinocytosis while dynamin inhibitor (Dyngo 4a) inhibits both macropinocytosis and clathrin‐mediated endocytosis. (A) Representative 20× widefield images of TRITC‐Dex70 uptake in control (DMSO) and treatment (cytochalasin D, wortmannin, Dyngo 4a, and PMA) conditions in BV2 microglia. Full FOV (top) and inset (bottom) merged images show TRITC‐Dex70 (green) and AF647‐WGA (red) overlaid. Inset scale bars are 20 µm wide. (B) Dose‐response graph of cytochalasin D, wortmannin, Dyngo 4a, and PMA on macropinocytic index (Dex70‐positive area normalized to percentage of cell area) in BV2 microglia, with x‐axis plotted on base‐10 log scale. (C) Representative 63× confocal images of AF488‐transferrin uptake in control (0.2% DMSO) and 40 µM Dyngo 4a treatment conditions in BV2 microglia. (D) Dose‐response graph of Dyngo 4a on AF488‐transferrin uptake quantified as number of AF488‐transferrin‐positive objects normalized by cell number. N = 3 biological replicates (independent experiments on BV2 microglia from different passages) each consisting of three replicate wells and two FOVs per replicate well. (E) Dose‐response graph of Dyngo 4a on AF488‐transferrin uptake quantified as numbers of AF488‐transferrin positive objects normalized by cell area. (F) Representative 63× confocal images of AF488‐transferrin uptake in control (DMSO) and treatment (cytochalasin D, wortmannin, Dyngo 4a, and PMA) conditions. (G) Graph of control (DMSO) and treatment (cytochalasin D, wortmannin, Dyngo 4a, and PMA) conditions on AF488‐transferrin uptake quantified as number of AF488‐transferrin‐positive objects normalized by cell area. (A, C, F) Scale bars are 20 µm wide. (C, F) Top row: full FOV merged images show AF488‐transferrin (green), AF647‐WGA (red), and Hoechst (blue) overlaid. Bottom row: representative mask image from size‐restricted ImageJ particle analysis AF488‐transferrin images. (D, E, G) N = 3 biological replicates (independent experiments on BV2 microglia from different passages) each consisting of two replicate wells and 10 FOVs per well. *p < 0.05, **p < 0.01, ***p < 0.001, ****p < 0.0001. Significance was calculated using mixed‐effects model one‐way ANOVA with Dunnett post hoc. DMSO, dimethyl sulfoxide; FOV, field of view; PI3K, phosphoinositide 3‐kinase; PKS, protein kinase C; PMA, inducer of protein kinase C.
FIGURE 3
FIGURE 3
Confocal microscopy analysis reveals that tau P301S uptake is variably inhibited by blockade of actin polymerization/dynamin activity and inconsistently enhanced by PKC induction (A) Representative 63× confocal images of AF488‐monomer (left), PFF (middle), and sPFF (right) uptake in control (DMSO) and treatment (cytochalasin D, wortmannin, Dyngo 4a, and PMA) conditions. Alternating columns display merged AF488‐tau (green), AF647‐WGA (red), and Hoechst (blue) channels (left) overlaid and tau pixel intensity maps (ImageJ “Fire” LUT; right). Scale bars are 20 µm wide. (B–G) Graphs of AF488‐tau integrated density in control (DMSO) and treatment (cytochalasin D, wortmannin, Dyngo 4a, and PMA) conditions. Dotted line is placed at approximate IntDen (a.u.) of cells not treated with AF488‐tau. *p < 0.05, **p < 0.01, ***p < 0.001, ****p < 0.0001. (B, C) Tau P301S monomers, (D, E) PFFs, (F, G) sPFFs. (B, D, F) = 3 biological replicates (independent experiments on BV2 microglia from different passages, each consisting of an average of 20 FOVs). Dotted line is placed at baseline IntDen (a.u.) of cells not treated with AF488‐tau. Significance was calculated using mixed‐effects model one‐way ANOVA with Dunnett post hoc. (C, E, G) N ≈ 60 FOVs across three biological replicates. Significance was calculated using ordinary one‐way ANOVA with Dunnett post hoc. DMSO, dimethyl sulfoxide; FOV, field of view; PFF, preformed fibril; PKS, protein kinase C;.
FIGURE 4
FIGURE 4
Flow cytometric analysis confirms that tau P301S PFF uptake in BV2 microglia is blocked by dynamin inhibitor Dyngo 4a. (A) Representative singlet count versus AF488‐PFF fluorescence histogram for control (DMSO, 0.1%) and cytochalasin D (0.25 µM). (B) Graph of tau PFF normalized MFI for control (DMSO, 0.1%), cytochalasin D (0.25 µM), wortmannin (0.5 µM), and PMA (0.2 µM). (C) Representative singlet count versus AF488‐PFF fluorescence histogram for control (DMSO, 0.1%) and Dyngo 4a (40 µM). (D) Graph of tau PFF normalized MFI for control (DMSO, 0.1%) and Dyngo 4a (10 to 40 µM). (B,D) N = 3 or 4 biological replicates (independent experiments on BV2 microglia from different passages), each consisting of two replicate wells and 10,000 cells (singlets) per well. *p < 0.05, **p < 0.01, ***p < 0.001, ****p < 0.0001. Significance was calculated using mixed effects model one‐way ANOVA with Dunnett post hoc. DMSO, dimethyl sulfoxide; MFI, median fluorescence intensity; PFF, preformed fibril; PMA, inducer of protein kinase C.
FIGURE 5
FIGURE 5
Antagonism of HSPGs and LRP1 in BV2 microglia reduces tau P301S PFF and monomer uptake, respectively. (A) Representative singlet count versus AF488‐PFF fluorescence histogram for control (0 µg/mL heparin) and treatment (200 µg/mL heparin). (B) Graph of tau PFF‐normalized MFI for 0 to 200 µg/mL heparin‐treated cells. (C) Representative singlet count versus AF488‐Monomer fluorescence histogram for control (0 µg/mL heparin) and treatment (200 µg/mL heparin). (D) Graph of AF488‐monomer‐normalized MFI for 0 to 200 µg/ml heparin‐treated cells. (E) Representative singlet count versus AF488‐PFF fluorescence histogram for control (0 µM RAP) and treatment (10 µM RAP). (F) Graph of AF488‐PFF‐normalized MFI for 0 to 10 µM RAP‐treated cells. (G) Representative singlet count versus AF488‐monomer fluorescence histogram for control (0 µM RAP) and treatment (10 µM RAP). (H) Graph of AF488‐monomer‐normalized MFI for 0 to 10 µM RAP‐treated cells. (B, D, F, H) N = 3 or 4 biological replicates (independent experiments on BV2 microglia from different passages), each consisting of two replicate wells and 10,000 cells (singlets) per well. *p < 0.05, **p < 0.01, ***p < 0.001, ****p < 0.0001. Significance was calculated using a mixed‐effects model one‐way ANOVA with Dunnett post hoc. HSPG, heparan‐sulfate proteoglycans; LRP1, lipoprotein receptor‐related protein 1; MFI, median fluorescence intensity; PFF, preformed fibril; RAP, receptor‐associated protein.
FIGURE 6
FIGURE 6
Inhibition of dynamin blocks 2N4R tau P301S monomer and aggregate endocytosis in adult primary microglia. (A) Representative 63× confocal images of AF488‐tau monomer fluorescence in adult C57BL/6J‐derived primary microglia control (DMSO) and treatment (cytochalasin D, wortmannin, Dyngo 4a, and PMA) conditions. (B) Graph of AF488‐tau monomer integrated density in C57BL/6J‐derived adult primary microglia control (DMSO) and treatment (cytochalasin D, wortmannin, Dyngo 4a, and PMA) conditions. (C) Representative 63× confocal images of AF488‐tau PFF fluorescence in C57BL/6J‐derived adult primary microglia control (DMSO) and treatment (cytochalasin D, wortmannin, Dyngo 4a, and PMA) conditions. (D) Graph of AF488‐tau PFF integrated density in C57BL/6J‐derived adult primary microglia control (DMSO) and treatment (cytochalasin D, wortmannin, Dyngo 4a, and PMA) conditions. (A, C) Rows display merged AF488‐tau (green), AF647‐WGA (red), and Hoechst (blue) channels (top) overlaid and tau pixel intensity maps (ImageJ “Fire” LUT; bottom). Scale bars are 10 µm wide. (B, D) N = 4 biological replicates (separate isolations of microglia; a combined two mouse brains were used for each paired data point). Male‐ and female‐derived microglial data points are shown as squares and circles, respectively. Dotted line is placed at baseline IntDen (a.u.) of cells not treated with AF488‐tau. *p < 0.05, **p < 0.01, ***p < 0.001, ****p < 0.0001. Statistical significance was calculated using mixed‐effects one‐way ANOVA with the Dunnett post hoc test. DMSO, dimethyl sulfoxide; PMA, inducer of protein kinase C.
FIGURE 7
FIGURE 7
In adult primary microglia, 2N4R tau P301S monomers are taken up via saturable, receptor‐mediated endocytosis but unaffected by HSPG and LRP1 antagonism. Meanwhile, fibril uptake is partially HSPG‐dependent. (A) Representative 63× confocal images of AF488‐tau monomer fluorescence in adult C57BL/6J‐derived primary microglia vehicle and heparin (200 µg/mL) conditions. (B) Graph of AF488‐tau monomer integrated density in vehicle and heparin (200 µg/mL) conditions. (C) Representative 63× confocal images of AF488‐tau PFF fluorescence in C57BL/6J‐derived adult primary microglia vehicle and heparin (200 µg/mL) conditions. (D) Graph of AF488‐tau PFF integrated density in vehicle and heparin (200 µg/mL heparin) conditions. (E) Representative 63× confocal images of AF488‐tau monomer fluorescence in adult C57BL/6J‐derived primary microglia vehicle and RAP (10 µM) conditions. (F) Graph of AF488‐tau monomer integrated density in vehicle and RAP (10 µM) conditions. (G) Representative 63× confocal images of AF488‐tau PFF fluorescence in adult C57BL/6J‐derived primary microglia vehicle and RAP (10 µM) conditions. (H) Graph of AF488‐tau PFF integrated density in vehicle and RAP (10 µM) conditions. (I) Representative 20× widefield images of AF488‐tau monomer uptake in response to unlabeled tau monomer in adult C57BL/6J‐derived primary microglia. (J) Line graph displaying dose response of unlabeled tau monomer on AF488‐tau monomer uptake (MFI) in adult C57BL/6J‐derived primary microglia. (K) Representative 20× widefield images of AF488‐tau PFF uptake in response to unlabeled tau PFF in adult C57BL/6J‐derived primary microglia. (L) Line graph displaying dose response of unlabeled tau PFF on AF488‐tau PFF uptake (MFI) in adult C57BL/6J‐derived primary microglia. (A, C, E, G) Rows display merged AF488‐tau (green), AF647‐WGA (red), and Hoechst (blue) channels (top) overlaid and tau pixel intensity maps (ImageJ “Fire” LUT; bottom). Scale bars are 10 µm wide. (I, K) Full FOV (top) and inset (bottom) merged images show AF488‐tau (green) and AF647‐WGA (red) overlaid. Inset scale bars are 20 µm wide. (B, D, F, H, J, L) N = 4 biological replicates (separate isolations of microglia; one mouse brain was used for each paired data point). *p < 0.05, **p < 0.01, ***p < 0.001, ****p < 0.0001. (B, D, F, H) Male‐ and female‐derived microglial data points are shown as squares and circles, respectively. Dotted line is placed at baseline IntDen (a.u.) of cells not treated with AF488‐tau. Statistical significance was calculated using a two‐tailed, paired Student t test. (J, L) Dotted line is placed at baseline MFI (a.u.) of cells not treated with AF488‐tau. Statistical significance was calculated using mixed‐effects one‐way ANOVA with the Dunnett post hoc test. HSPG, heparan‐sulfate proteoglycans; MFI, median fluorescence intensity; PFF, preformed fibril; PMA, inducer of protein kinase C; RAP, receptor‐associated protein.
FIGURE 8
FIGURE 8
TAT‐Cre treatment of Ai14;LRP1fl/fl microglia depletes LRP1 expression and enhances tau uptake independently of LRP1 knockdown. (A) Representative 63× confocal images of LRP1 immunopositivity (green) and tdTomato fluorescence (red) in LRP1fl/fl;Ai14‐derived adult primary microglia control (0 U/mL TAT‐Cre) and treatment (100 U/mL TAT‐Cre). (B) Graph of LRP1‐positive integrated density (min–max normalized integrated density) in adult LRP1fl/fl;Ai14‐derived primary microglia control (0 U/mL TAT‐Cre) and treatment (100 U/ml TAT‐Cre). (C) Graph of tdTomato fluorescence (integrated density) in adult LRP1fl/fl;Ai14‐derived primary microglia control (0 U/mL TAT‐Cre) and treatment (100 U/mL TAT‐Cre). (D) Representative 63× confocal images of AF488‐tau monomer fluorescence in adult flox‐control (Ai14) and LRP1 cKO (LRP1fl/fl;Ai14)‐derived primary microglia exposed to Cre‐control (0 U/mL TAT‐Cre) or Cre (100 U/ml TAT‐Cre) treatment conditions. (E) Graph of AF488‐tau monomer integrated density in adult flox‐control (Ai14) and LRP1 cKO (LRP1fl/fl;Ai14)‐derived primary microglia exposed to Cre‐control (0 U/mL TAT‐Cre) or Cre (100 U/mL TAT‐Cre) treatment conditions. (F) Graph of AF488‐tau monomer‐normalized integrated density (percentage of Cre‐control) in adult flox‐control (Ai14) and LRP1 cKO (LRP1fl/fl;Ai14)‐derived primary microglia. (G) Representative 63× confocal images of AF488‐tau monomer fluorescence in adult flox‐control (Ai14) and LRP1 cKO (LRP1fl/fl;Ai14)‐derived primary microglia exposed to Cre‐control (0 U/mL TAT‐Cre) or Cre (100 U/mL TAT‐Cre) treatment conditions. (H) Graph of AF488‐tau PFF integrated density in adult flox‐control (Ai14) and LRP1 cKO (LRP1fl/fl;Ai14)‐derived primary microglia exposed to Cre‐control (0 U/mL TAT‐Cre) or Cre (100 U/mL TAT‐Cre) treatment conditions. (I) Graph of AF488‐tau PFF‐normalized integrated density (percentage of Cre control) in adult flox‐control (Ai14) and LRP1 cKO (LRP1fl/fl;Ai14)‐derived primary microglia. (J) Representative 63× confocal images of AF488‐tau monomer (left) and PFF (right) fluorescence in adult Ai14‐derived adult primary microglia exposed to vehicle, TAT (2 µM), or TAT‐Cre (2 µM) treatment conditions. (K) Graph of AF488‐tau monomer integrated density in adult Ai14‐derived adult primary microglia exposed to vehicle, TAT (2 µM), or TAT‐Cre (2 µM) treatment conditions. (L) Graph of AF488‐tau PFF integrated density in adult Ai14‐derived adult primary microglia exposed to vehicle, TAT (2 µM), or TAT‐Cre (2 µM) treatment conditions. (D, G, J) Rows display merged AF488‐tau (green), AF647‐WGA (red), and Hoechst (blue) channels (top) overlaid and tau pixel intensity maps (ImageJ “Fire” LUT; bottom). Scale bars are 10 µm wide. (B, C, E, F, H, I, K, L) N = 3 or 4 biological replicates (separate isolations of microglia from one mouse brain per paired data point). Male‐ and female‐derived microglial data points are shown as squares and circles, respectively. *p < 0.05, **p < 0.01, ***p < 0.001, ****p < 0.0001. (B, C, F, I) Statistical significance was calculated using a two‐tailed, paired Student t test. (E, H) Statistical significance was calculated using two‐way ANOVA with Tukey's post hoc test. (K, L) Statistical significance was calculated using mixed‐effects one‐way ANOVA with the Dunnett post hoc test. LRP1, lipoprotein receptor‐related protein 1; PFF, preformed fibril.

Similar articles

Cited by

References

    1. Nelson PT, Alafuzoff I, Bigio EH, et al. Correlation of Alzheimer disease neuropathologic changes with cognitive status: A review of the literature. J Neuropathol Exp Neurol. 2012;71(5):362‐381. doi:10.1097/NEN.0b013e31825018f7 - DOI - PMC - PubMed
    1. Koga S, Parks A, Kasanuki K, et al. Cognitive impairment in progressive supranuclear palsy is associated with tau burden. Mov Disord. 2017;32(12):1772‐1779. doi:10.1002/mds.27198 - DOI - PMC - PubMed
    1. Clavaguera F, Akatsu H, Fraser G, et al. Brain homogenates from human tauopathies induce tau inclusions in mouse brain. Proc Natl Acad Sci U S A. 2013;110(23):9535‐9540. doi:10.1073/pnas.1301175110 - DOI - PMC - PubMed
    1. Santa‐Maria I, Varghese M, Ksiȩzak‐Reding H, Dzhun A, Wang J, Pasinetti GM. Paired helical filaments from Alzheimer disease brain induce intracellular accumulation of tau protein in aggresomes. J Biol Chem. 2012;287(24):20522‐20533. doi:10.1074/JBC.M111.323279/ATTACHMENT/983165C9-D389-4139-8453-C99817274557/MMC1.PDF - DOI - PMC - PubMed
    1. Clavaguera F, Bolmont T, Crowther RA, et al. Transmission and spreading of tauopathy in transgenic mouse brain. Nat Cell Biol. 2009;11(7):909‐913. doi:10.1038/ncb1901 - DOI - PMC - PubMed

Substances