Neuropathological correlates of vulnerability and resilience in the cerebellum in Alzheimer's disease
- PMID: 39713867
- PMCID: PMC11848203
- DOI: 10.1002/alz.14428
Neuropathological correlates of vulnerability and resilience in the cerebellum in Alzheimer's disease
Abstract
Introduction: We investigated whether the cerebellum develops neuropathology that correlates with well-accepted Alzheimer's disease (AD) neuropathological markers and cognitive status.
Methods: We studied cerebellar cytoarchitecture in a cohort (N = 30) of brain donors. In a larger cohort (N = 605), we queried whether the weight of the contents of the posterior fossa (PF), which contains primarily cerebellum, correlated with dementia status.
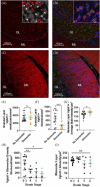
Results: Although there was no granular layer (GL) cell loss, GL area was lower in AD cases, particularly in the lateral cerebellum. Lower numbers of mossy fiber synaptic terminals in the cerebellar GL of AD cases correlated with Braak stages IV-VI. PF content weight correlated with dementia independently of age, neuropathology, and education. In addition, we found that a measure of the relative size of the PF content weight to total brain weight correlated with less dementia.
Discussion: These results confirm that the cerebellum is not spared neuropathological damage in AD.
Highlights: Novel evidence of cerebellar atrophy in the granule cell layer of the lateral cerebellar cortex (or 'cognitive cerebellum'), and loss of a specific cerebellar synapse type in this region, the cerebellar glomerulus. Both correlated with dementia status and Braak stages IV through VI, in a cohort with complete neuropathological characterization. Although there have been recent brain imaging studies suggesting a role for cerebellum in Alzheimer's disease, we believe our study constitutes some of the most concrete neuropathological evidence to date of anatomic and synaptic substrates that are disrupted in AD. These changes in this cerebellar region may even play a role in the etiology of cognitive symptoms. Novel evidence that individuals with lower postmortem cerebellar weights showed more cognitive decline, independent of classical neuropathology markers such as Braak stage, Thal phase, or Corsortium to Establish a Registry for Alzheimer's Disease (CERAD) score, suggesting a role for this brain region in dementia, using advanced statistical analysis of a large unbiased population cohort (n = 605), the Adult Changes in Thought (ACT) study. Conversely, a measure of how intact the cerebellum was correlated with less dementia, independent of classical neuropathology markers and cerebral cortical weight, again, in the ACT cohort of 605 brain donors. We believe that this novel finding has relevance and implications for the identification of resilience factors, which may protect against the development of dementia.
Keywords: cerebellar glomerulus; cerebellar reserve; cognition; granule cells; posterior fossa contents; synapse loss.
© 2024 The Author(s). Alzheimer's & Dementia published by Wiley Periodicals LLC on behalf of Alzheimer's Association.
Conflict of interest statement
The authors report no conflicts or competing interests. Author disclosures are available in the supporting information.
Figures


References
-
- Tomlinson BE. Plaques, tangles and Alzheimer's disease. Psychol Med. 1982;12(3):449‐459. - PubMed
-
- Thal DR, Rüb U, Orantes M, Braak H. Phases of A beta‐deposition in the human brain and its relevance for the development of AD. Neurology. 2002;58(12):1791‐1800. - PubMed
-
- Braak H, Braak E, Bohl J, Lang W. Alzheimer's disease: amyloid plaques in the cerebellum. J Neurol Sci. 1989;93(2‐3):277‐287. - PubMed
-
- Andersen K, Andersen BB, Pakkenberg B. Stereological quantification of the cerebellum in patients with Alzheimer's disease. Neurobiol Aging. 2012;33(1):197 e11‐20. - PubMed
MeSH terms
Grants and funding
- R01MH116883/NIH/NIMH
- R01 AG075338/AG/NIA NIH HHS/United States
- R01MH116883-S1/NIH/NIMH
- K08 AG065426-05/National Institute on Aging (NIA)
- I01 RX003829/RX/RRD VA/United States
- I01 BX002311/BX/BLRD VA/United States
- P50 AG005136/AG/NIA NIH HHS/United States
- T32 AG052354/AG/NIA NIH HHS/United States
- I01 BX005984/BX/BLRD VA/United States
- U19 AG066567/AG/NIA NIH HHS/United States
- P50 AG005136)/NIH/NIMH
- RO1AG075338/National Institute on Aging (NIA)
- AG052354-05/NIH/NIA
- VAPSHCS Postdoctoral Training Grant
- P30 AG066509/AG/NIA NIH HHS/United States
- NH/NIH HHS/United States
- K08 AG065426/AG/NIA NIH HHS/United States
- R01 MH116883/MH/NIMH NIH HHS/United States
- 1I01RX003829/Department of Veterans Affairs Office of Research and Development Medical Research Service awards
- Nancy and Buster Alvord Endowment
- 1I01BX005984/Department of Veterans Affairs Office of Research and Development Medical Research Service awards
- 1I01BX002311/Department of Veterans Affairs Office of Research and Development Medical Research Service awards
LinkOut - more resources
Full Text Sources
Medical

