. 2025 Feb;21(2):e14442.
doi: 10.1002/alz.14442. Epub 2024 Dec 23.

Plasma Aβ42/Aβ40 is sensitive to early cerebral amyloid accumulation and predicts risk of cognitive decline across the Alzheimer's disease spectrum

Affiliations

Plasma Aβ42/Aβ40 is sensitive to early cerebral amyloid accumulation and predicts risk of cognitive decline across the Alzheimer's disease spectrum

Alexandra N Trelle et al. Alzheimers Dement. 2025 Feb.

Abstract

Introduction: The availability of amyloid beta (Aβ) targeting therapies for Alzheimer's disease (AD) is increasing the demand for scalable biomarkers that are sensitive to early cerebral Aβ accumulation.

Methods: We evaluated fully-automated Lumipulse plasma Aβ42/Aβ40 immunoassays for detecting cerebral Aβ in 457 clinically unimpaired (CU) and clinically impaired (CI) Stanford Alzheimer's Disease Research Center (Stanford ADRC) participants and 186 CU in the Stanford Aging and Memory Study (SAMS). Longitudinal change in ADRC plasma Aβ42/Aβ40 and cognition and cross-sectional associations with SAMS memory and tau positron emission tomography (PET) were examined.

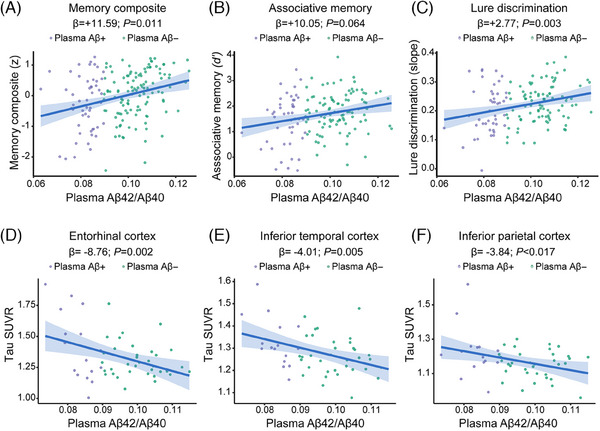
Results: Plasma Aβ42/Aβ40 exhibited high performance in detecting amyloid positivity defined by PET (area under the curve [AUC]: 0.885, 95% confidence interval [CI]: 0.816-0.955). Once abnomal, plasma Aβ42/Aβ40 remained low and predicted cognitive decline in both CU and CI individuals. Among SAMS CU, plasma Aβ42/Aβ40 was associated with poorer hippocampal-dependent memory and elevated tau accumulation.

Discussion: Lumipulse plasma Aβ42/Aβ40 is a scalable assay for detection of cerebral Aβ and prediction of risk for cognitive decline across the AD continuum.

Highlights: Lumipulse plasma amyloid beta (Aβ)42/Aβ40 exhibited high accuracy in detecting amyloid positivity. Plasma amyloid-positive (Aβ+) individuals exhibited stability of Aβ42/Aβ40 over time. Plasma Aβ42/Aβ40 predicted future cognitive decline across the Alzheimer's disease (AD) spectrum. Plasma Aβ42/Aβ40 was sensitive to memory and tau burden in clinically unimpaired older adults.

Keywords: Alzheimer's disease; blood biomarkers; cognition; plasma Aβ42/Aβ40.


Conflict of interest statement

The authors declare no conflicts of interest. Author disclosures are available in the supporting information.

Figures

FIGURE 1
FIGURE 1
Plasma Aβ42/Aβ40 detects cerebral amyloid accumulation along the AD spectrum. (A) Boxplots showing the distribution of plasma Aβ42/Aβ40 in Stanford ADRC, CU, MCI, and AD participants stratified according to CSF‐ or PET‐defined Aβ status (n = 181). Midline of the boxplots indicates the median and the box indicates the 25th and 75th percentiles. Analyzed by ANOVA with age and sex included as covariates. *p < 0.05; ****p < 0.0001. (B) Plasma Aβ42/Aβ40 in Stanford ADRC participants stratified according to A/T classification using CSF Aβ42/Aβ40 and p‐tau181 (n = 93). Analyzed by ANOVA with Tukey's post hoc test and with age and sex included as covariates. ****p < 0.0001. (C) Plasma Aβ42/Aβ40 levels in Stanford ADRC participants according to APOE ε4 carriage across the clinical diagnostic groups. APOE ε4 carriage was defined as harboring 0, 1, or 2 copies of the ε4 allele (n = 389). Analyzed by ANOVA with Tukey's post hoc test and with age and sex included as covariates. *p < 0.05; **p < 0.01; ***p < 0.001. Aβ, amyloid beta; AD, Alzheimer's disease; ADRC, Alzheimer's Disease Research Center; ANOVA, analysis of variance; APOE, apolipoprotein E gene; CU, clinically unimpaired; CSF, cerebrospinal fluid; MCI, mild cognitive impairment; p‐tau181, phosphorylated tau‐181; PET, positron emission tomography.
FIGURE 2
FIGURE 2
Performance of plasma Aβ42/Aβ40 in discriminating amyloid PET status. (A) Boxplots showing plasma Aβ42/Aβ40 stratified according to PET‐defined amyloid status (n = 106). The derived optimal cutoff determined using the Youden method was 0.0896. (B) ROC curves showing that plasma Aβ42/Aβ40 discriminates amyloid PET‐defined amyloid status with high accuracy (AUC: 0.896—full ROC parameters in Table 2) when age, sex, and APOE ε4 status are included in the model (n = 106; demographic information included in Table S1). Models were compared using DeLong's test. *p < 0.05. (C) Concordance between plasma Aβ42/Aβ40 and amyloid PET Centiloids (CL; n = 112). Respective cutoffs for each modality are shown, giving rise to four plasma and amyloid PET participant profiles. Aβ, amyloid beta; AD, Alzheimer's disease; APOE, apolipoprotein E gene; AUC, area under the curve; CU, clinically unimpaired; MCI, mild cognitive impairment; PET, positron emission tomography; ROC, receiver‐operating characteristic.
FIGURE 3
FIGURE 3
Plasma Aβ42/Aβ40 associates with functional and cognitive impairment in participants along the AD spectrum. (A) Boxplots showing the distribution of plasma Aβ42/Aβ40 in Stanford ADRC participants stratified according to CDR Global score (n = 444). CDR scores of 1 and above were combined. Analyzed by ANOVA with age, sex, and years of education included as covariates. (B) Linear regression analysis of plasma Aβ42/Aβ40 versus CDR‐SB in CU (blue) and CI (orange) Stanford ADRC participants (n = 444). MCI and AD were combined into a single CI group. Plotted are the 95% confidence bands of the best‐fit lines from the linear regressions. β estimates and p‐values from the linear model are shown. Age, sex, and years of education were included as covariates in the models. (C) Linear regression analysis of plasma Aβ42/Aβ40 versus MoCA score in CU (blue) and CI (orange) Stanford ADRC participants (n = 312). MCI and AD were combined into a single CI group. Plotted are the 95% confidence bands of the best‐fit lines from the linear regressions. β estimates and p‐values from the linear model are shown. Age, sex, and years of education were included as covariates in the models. (D) Linear regression analysis of plasma Aβ42/Aβ40 versus z‐score on memory composite in CI (orange) and CI (orange) Stanford ADRC participants (n = 273). Shown are the regression lines and 95% confidence intervals. Age, sex, and years of education are included as covariates in the models. Aβ, amyloid beta; AD, Alzheimer's disease; ADRC, Alzheimer's Disease Research Center; ANOVA, analysis of variance; CDR‐SB, Clinical Dementia Rating—Sum of Boxes; CU, clinically unimpaired; CI, clinically impaired; MCI, mild cognitive impairment; MoCA, Montreal Cognitive Assessment.
FIGURE 4
FIGURE 4
Declines in plasma Aβ42/Aβ40 are enduring and predict accelerated cognitive decline. (A) Longitudinal plasma Aβ42/Aβ40 in CU and CI Stanford ADRC participants stratified by plasma Aβ status (n = 191). Trajectory plots indicate the mean longitudinal trajectories (solid line) of plasma Aβ42/Aβ40 and associated 95% CIs (shading), estimated with linear mixed‐effects models. Trajectories are stratified based on plasma‐defined clinical‐biomarker groups (CU Aβ−, CU Aβ+, CI Aβ−, CI Aβ+) modeled with an interaction term between group and time (from initial blood draw). Models included random intercepts for each participant and were adjusted for sex and age at first visit. β estimates and p‐values reflect post hoc tests comparing the slope for each group to zero. Characteristics of Stanford ADRC population with longitudinal plasma Aβ42/Aβ40 data are described in Table S4. (B) Longitudinal MoCA score in CU and CI Stanford ADRC participants stratified by plasma Aβ status (n = 198). Trajectory plots indicate the mean longitudinal trajectories (solid line) of MoCA scores and associated 95% CIs (shading), estimated with linear mixed‐effects models. Trajectories are stratified based on plasma‐defined clinical‐biomarker groups (CU Aβ−, CU Aβ+, CI Aβ−, CI Aβ+) modeled with an interaction term between group and time (from initial cognitive assessment). Models included random intercepts for each participant and were adjusted for years of education, sex, and age at first visit. β estimates and p‐values reflect post hoc tests comparing the slope for each group to zero. Characteristics of Stanford ADRC population with longitudinal cognitive data are described in Table S5. (C) Longitudinal episodic memory composite z‐scores in CU and CI Stanford ADRC participants stratified by plasma Aβ status (n = 187). Trajectory plots indicate the mean longitudinal trajectories (solid line) of memory composite scores and associated 95% CIs (shading), estimated with linear mixed‐effects models. Trajectories are stratified based on plasma‐defined clinical‐biomarker groups (CU Aβ−, CU Aβ+, CI Aβ−, CI Aβ+) modeled with an interaction term between group and time (from initial cognitive assessment). Models included random intercepts for each participant and were adjusted for years of education, sex, and age at first visit. β estimates and p‐values reflect post hoc tests comparing the slope for each group to zero. Aβ, amyloid beta; ADRC, Alzheimer's Disease Research Center; CDR, Clinical Dementia Rating; CU, clinically unimpaired; CI, clinically impaired; MoCA, Montreal Cognitive Assessment.
FIGURE 5
FIGURE 5
Plasma Aβ42/Aβ40 detects cerebral amyloid accumulation in clinically unimpaired older adults. (A) Boxplot showing the distribution of plasma Aβ42/Aβ40 in SAMS CU participants stratified according to CSF Aβ42/Aβ40 or Aβ PET status (n = 147). Analyzed by ANOVA with age and sex included as covariates. ****p < 0.0001. (B) Plasma Aβ42/Aβ40 in SAMS CU participants stratified according to A/T classification using CSF biomarkers (n = 130). Analyzed by ANOVA with Tukey's post hoc test and with age and sex included as covariates. ***p < 0.001. (C) Plasma Aβ42/Aβ40 levels in SAMS CU participants carrying 0, 1, or 2 copies of APOE ε4 (n = 183). Analyzed by ANOVA with Tukey's post hoc test and with age and sex included as covariates. *p < 0.05; **p < 0.01. (D) Concordance between plasma Aβ42/Aβ40 and CSF Aβ42/Aβ40 in SAMS CU (n = 130). Respective cutoffs for each modality are shown, giving rise to four plasma and CSF Aβ42/Aβ40 participant profiles. Aβ, amyloid beta; CU, clinically unimpaired; PET, positron emission tomography; SAMS, Stanford Aging and Memory Study.
FIGURE 6
FIGURE 6
Plasma Aβ42/Aβ40 associates with cognition and early tau accumulation in clinically unimpaired older adults. (A) Linear regression analysis of plasma Aβ42/Aβ40 associations with delayed recall composite score (z‐score) in 168 SAMS CU participants. Plotted is the 95% confidence band of the best‐fit line from the linear regression. Β estimate and p‐value from the linear model is shown. Age, sex, and years of education were included as covariates. (B) Linear regression analysis of plasma Aβ42/Aβ40 versus performance on the associative memory task (d’) in 147 SAMS CU participants. Age, sex, and years of education were included as covariates. (C) Linear mixed‐effects models assessed the relationship Aβ42/Aβ40 and performance on the lure discrimination task as a function of target‐lure similarity in 135 SAMS CU participants. Age, sex, and years of education and their interaction with similarity were included as covariates. β estimate and p‐value indicating the Aβ42/Aβ40 × similarity interaction is shown. For visualization purposes only, participant slopes reflecting change in performance as target‐lure similarity decreased are plotted against plasma Aβ42/Aβ40. (D) Linear regression analysis of plasma Aβ42/Aβ40 versus tau PET SUVR in the entorhinal cortex in 51 SAMS CU participants. Age and sex were included as covariates. Characteristics of SAMS CU population with tau PET data are described in Table S6. (E) Linear regression analysis of plasma Aβ42/Aβ40 versus tau PET SUVR in the inferior temporal cortex in 51 SAMS CU participants. Age and sex were included as covariates. (F) Linear regression analysis of plasma Aβ42/Aβ40 versus tau PET SUVR in the inferior parietal cortex in 51 SAMS CU participants. Age and sex were included as covariates. Aβ, amyloid beta; CU, clinically unimpaired; PET, positron emission tomography; SAMS, Stanford Aging and Memory Study; SUVRs, standardized uptake value ratios.

Similar articles

Cited by

References

    1. Hampel H, Hu Y, Cummings J, et al. Blood‐based biomarkers for Alzheimer's disease: current state and future use in a transformed global healthcare landscape. Neuron. 2023;111(18):2781‐2799. doi:10.1016/j.neuron.2023.05.017 - DOI - PMC - PubMed
    1. Mattsson‐Carlgren N, Collij LE, Stomrud E, et al. Plasma Biomarker strategy for selecting patients with Alzheimer disease for antiamyloid immunotherapies. JAMA Neurol. 2024;81(1):69‐78. doi:10.1001/jamaneurol.2023.4596 - DOI - PMC - PubMed
    1. Sperling R, Mormino E, Johnson K. The evolution of preclinical Alzheimer's disease: implications for prevention trials. Neuron. 2014;84(3):608‐622. doi:10.1016/j.neuron.2014.10.038 - DOI - PMC - PubMed
    1. McDade E, Llibre‐Guerra JJ, Holtzman DM, Morris JC, Bateman RJ. The informed road map to prevention of Alzheimer disease: a call to arms. Mol Neurodegener. 2021;16(1):49. doi:10.1186/s13024-021-00467-y - DOI - PMC - PubMed
    1. Rafii MS, Sperling RA, Donohue MC, et al. The AHEAD 3‐45 Study: design of a prevention trial for Alzheimer's disease. Alzheimers Dement. 2023;19(4):1227‐1233. doi:10.1002/alz.12748 - DOI - PMC - PubMed