

Development of a physiologically-based pharmacokinetic model for Ritonavir characterizing exposure and drug interaction potential at both acute and steady-state conditions
- PMID: 39714044
- PMCID: PMC11919272
- DOI: 10.1002/psp4.13293
Development of a physiologically-based pharmacokinetic model for Ritonavir characterizing exposure and drug interaction potential at both acute and steady-state conditions
Abstract
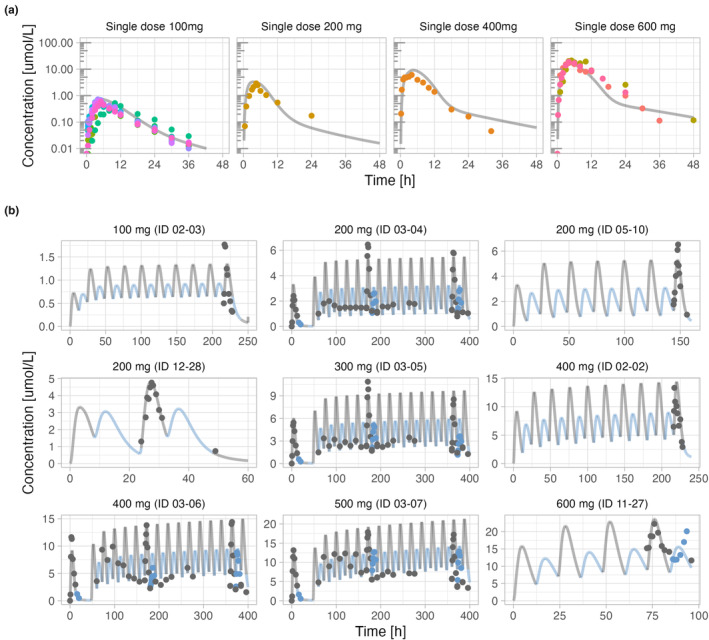
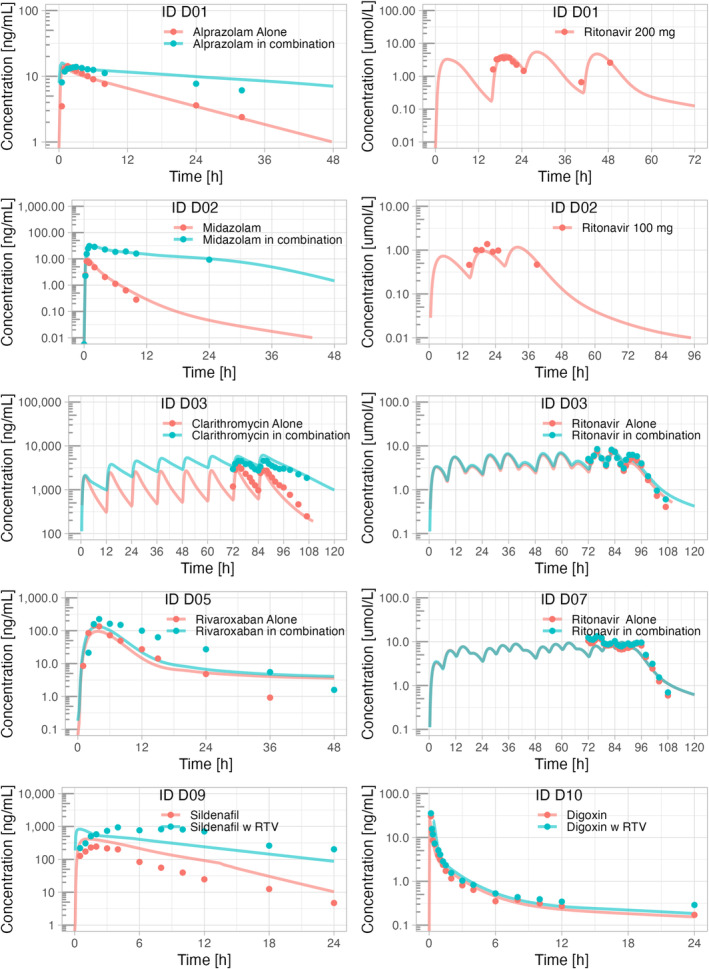
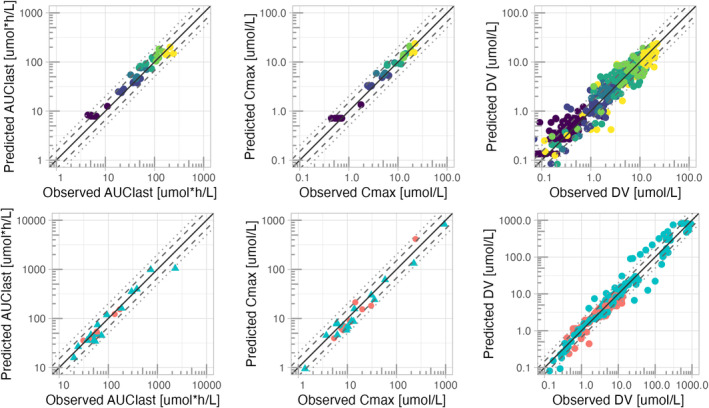
Ritonavir (RTV) is a potent CYP3A inhibitor that is widely used as a pharmacokinetic (PK) enhancer to increase exposure to select protease inhibitors. However, as a strong and complex perpetrator of CYP3A interactions, RTV can also enhance the exposure of other co-administered CYP3A substrates, potentially causing toxicity. Therefore, the prediction of drug-drug interactions (DDIs) and estimation of dosing requirements for concomitantly administered drugs is imperative. In this study, we aimed to develop a physiologically-based PK (PBPK) model for RTV using the PK-sim® software platform. A total of 13 clinical PK studies of RTV covering a wide dose range (100 to 600 mg including both single and multiple dosing), and eight clinical DDI studies with RTV on CYP3A and P-gp substrates, including alprazolam, midazolam, rivaroxaban, clarithromycin, fluconazole, sildenafil, and digoxin were used for the model development and evaluation. Chronopharmacokinetic differences (between morning vs. evening doses) and limitations in parameter estimation for biochemical processes of RTV from in vitro studies were incorporated in the PBPK model. The final developed PBPK model predicted 100% of RTV AUClast and Cmax within a twofold dimension error. The geometric mean fold error (GMFE) from all PK datasets was 1.275 and 1.194, respectively. In addition, 97% of the DDI profiles were predicted with the DDI ratios within a twofold dimension error. The GMFE values from all DDI datasets were 1.297 and 1.212, respectively. Accordingly, this model could be applied to the prediction of DDI profiles of RTV and CYP3A substrates and used to estimate dosing requirements for concomitantly administered drugs.
© 2024 The Author(s). CPT: Pharmacometrics & Systems Pharmacology published by Wiley Periodicals LLC on behalf of American Society for Clinical Pharmacology and Therapeutics.
Conflict of interest statement
The authors declared no competing interests in this work.
Figures
References
-
- Kumar GN, Rodrigues AD, Buko AM, Denissen JF. Cytochrome P450‐mediated metabolism of the HIV‐1 protease inhibitor ritonavir (ABT‐538) in human liver microsomes. J Pharmacol Exp Ther. 1996;277:423‐431. - PubMed
-
- Moltke LLL, Durol ALBBLB, Duan SXX, Greenblatt DJJ. Potent mechanism‐based inhibition of human CYP3A in vitro by amprenavir and ritonavir: comparison with ketoconazole. Eur J Clin Pharmacol. 2000;56:259‐261. - PubMed
-
- Rock BM, Hengel SM, Rock DA, Wienkers LC, Kunze KL. Characterization of ritonavir‐mediated inactivation of cytochrome P450 3A4. Mol Pharmacol. 2014;86:665‐674. - PubMed
-
- Ernest CSS, Hall SDD, Jones DRR. Mechanism‐based inactivation of CYP3A by HIV protease inhibitors. J Pharmacol Exp Ther. 2005;312:583‐591. - PubMed
-
- Granfors MTT, Wang JS, Kajosaari LI, Laitila J, Neuvonen PJ, Backman JT. Differential inhibition of cytochrome P450 3A4, 3A5 and 3A7 by five human immunodeficiency virus (HIV) protease inhibitors in vitro. Basic Clin Pharmacol Toxicol. 2006;98:79‐85. - PubMed
MeSH terms
Substances
Grants and funding
- RS-2023-00278597/Chungnam National University, National Research Foundation of Korea (NRF)
- NRF-2022R1A2C1010929/Chungnam National University, National Research Foundation of Korea (NRF)
- 2022R1A5A7085156/Chungnam National University, National Research Foundation of Korea (NRF)
- RS-2024-00460694/Ministry of Health & Welfare and Ministry of Science and ICT, Republic of Korea
LinkOut - more resources
Full Text Sources
Miscellaneous
