. 2025 Jan 21;10(1):e0131524.
doi: 10.1128/msystems.01315-24. Epub 2024 Dec 23.

Revealing systematic changes in the transcriptome during the transition from exponential growth to stationary phase

Affiliations

Revealing systematic changes in the transcriptome during the transition from exponential growth to stationary phase

Hyun Gyu Lim et al. mSystems. .

Abstract

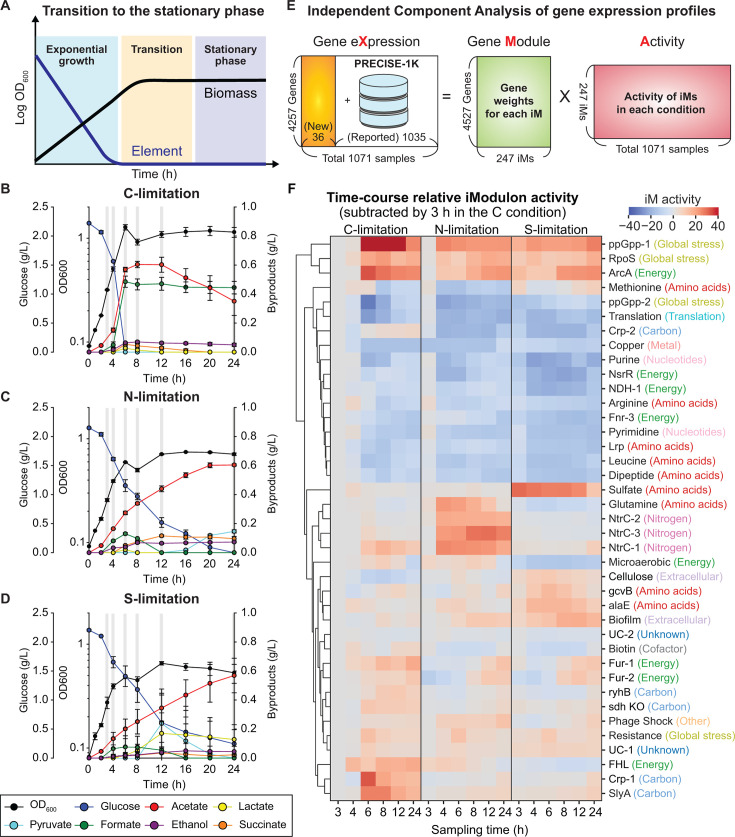
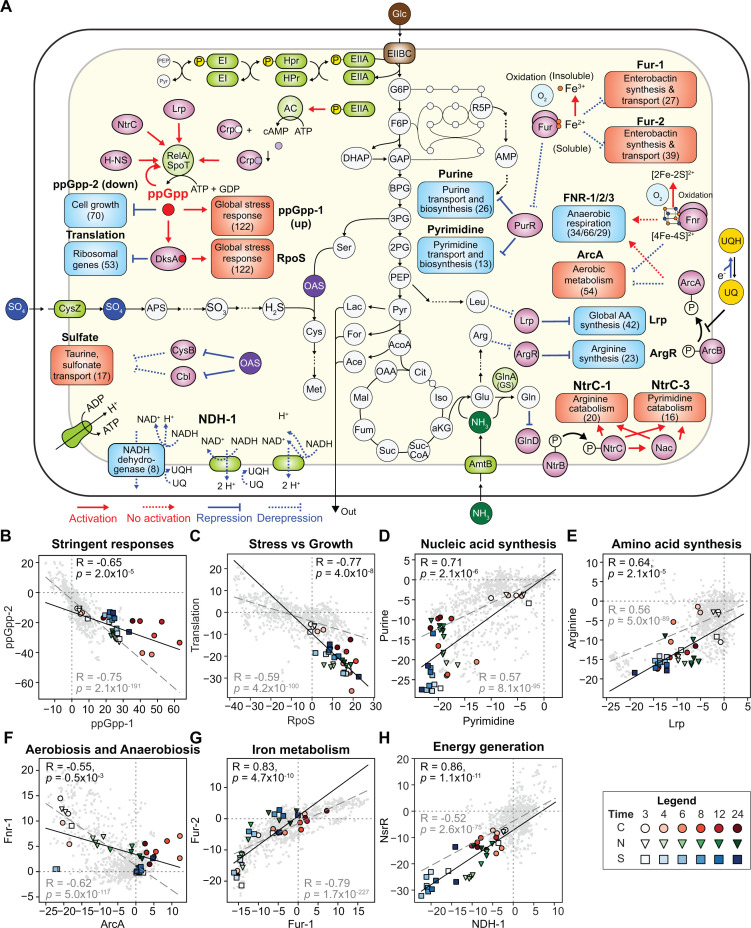
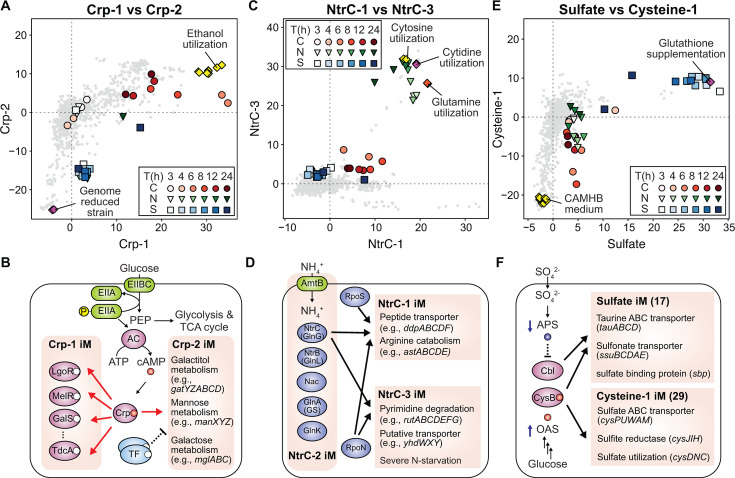
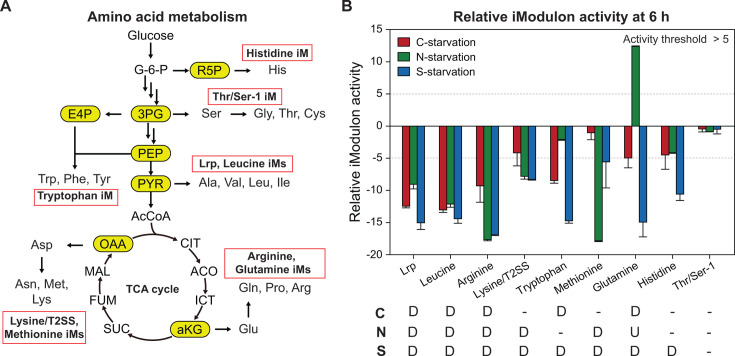
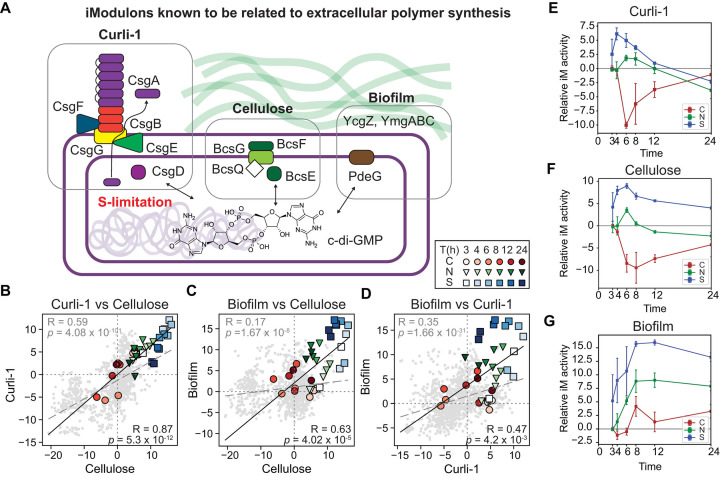
The composition of bacterial transcriptomes is determined by the transcriptional regulatory network (TRN). The TRN regulates the transition from one physiological state to another. Here, we use independent component analysis to monitor the composition of the transcriptome during the transition from the exponential growth phase to the stationary phase. With Escherichia coli K-12 MG1655 as a model strain, we trigger the transition using carbon, nitrogen, and sulfur starvation. We find that (i) the transition to the stationary phase accompanies common transcriptome changes, including increased stringent responses and reduced production of cellular building blocks and energy regardless of the limiting element; (ii) condition-specific changes are strongly associated with transcriptional regulators (e.g., Crp, NtrC, CysB, Cbl) responsible for metabolizing the limiting element; and (iii) the shortage of each limiting element differentially affects the production of amino acids and extracellular polymers. This study demonstrates how the combination of genome-scale datasets and new data analytics reveals the fundamental characteristics of a key transition in the life cycle of bacteria.

Importance: Nutrient limitations are critical environmental perturbations in bacterial physiology. Despite its importance, a detailed understanding of how bacterial transcriptomes are adjusted has been limited. By utilizing independent component analysis (ICA) to decompose transcriptome data, this study reveals key regulatory events that enable bacteria to adapt to nutrient limitations. The findings not only highlight common responses, such as the stringent response, but also condition-specific regulatory shifts associated with carbon, nitrogen, and sulfur starvation. The insights gained from this work advance our knowledge of bacterial physiology, gene regulation, and metabolic adaptation.

Keywords: RNA-sequencing; independent component analysis; nutrient starvation; stationary phase; stress; systems biology; transcriptome.


Conflict of interest statement

The authors declare no conflict of interest.

Figures

Fig 1
Fig 1
ICA of nutrient limitation-induced transition to the stationary phase. (A) A time-course schematic of bacterial growth. (B-D) Growth and exo-metabolic data during transition into the stationary phase under (B) C, (C) N, and (D) S limitations. (E) Decomposition of a gene expression matrix “X” into a gene weight matrix “M” and an activity matrix “A” for each iModulon (condition-independent groupings of co-regulated genes). ICA was performed for a total of 1,071 transcriptomes, 36 samples generated in this study, and 1,035 samples from PRECISE-1K (9). (F) Time-course relative activity of 39 iModulons with explained variances greater than 0.5% as a threshold. iModulons were hierarchically clustered with their activities. All activities were normalized by the activity at 3 h in the C-limiting condition. Each color indicates the category of iModulons.
Fig 2
Fig 2
Activities of iModulons obtained from ICA for the 36 stationary-phase RNAseq samples. (A) A map that outlines the functions of iModulons with the strongest changes in activities during the transition to the stationary phase. (B-H) Compared iModulon activities of the 14 representative iModulons: (B) ppGpp-1 vs ppGpp-2, (C) RpoS vs Translation, (D) Pyrimidine vs Purine, (E) Lrp vs Arginine, (F) ArcA vs Fnr-1, (G) Fur-1 vs Fur-2, and (H) NDH-1 vs NsrR. Black lines and grey dotted lines indicate correlations among the 36 samples and the entire samples, respectively. Pearson correlations (R) and corresponding P-values were given. Symbols: red circles, C-limiting; green inverted triangles, N-limiting; blue squares, S-limiting.
Fig 3
Fig 3
Distinctive global transcriptome changes depending on starving nutrients. (A-F) Activities, functions, and related regulators for iModulons related to the C, N, and S metabolism. (A) Activity changes of the Crp-1 and Crp-2 iModulons. iModulon activities of PRECISE-1K samples under ethanol utilization (5 g/L) as a sole carbon source, and genome-reduced strains were additionally indicated. (B) Regulation of Crp for the two iModulons. (C) Activity changes of the NtrC-1 and NtrC-3 iModulons. iModulon activities of PRECISE-1K samples under the utilization of either cytosine, cytidine, and glutamine as a N source were additionally indicated. (D) Regulation of NtrC for the two iModulons. (E) Activity changes of the sulfate and cysteine-1 iModulons. iModulon activities of PRECISE-1K samples in the CAMHB medium or with the supplementation of glutathione were additionally indicated. (F) Regulation of Cbl and CysB for the two iModulons. Symbols: red circles, C-limiting; green inverted triangles, N-limiting; blue squares, S-limiting.
Fig 4
Fig 4
Different activity changes of amino acid metabolism-related iModulons. (A) Simplified metabolic pathway map for amino acid metabolism and related iModulons. (B) Relative iModulon activity at 6 h compared with their activities in the C-limiting condition at 3 h. “D”, “U”, and “-” indicates “downregulation,” “upregulation,” and “no change,” respectively, with an activity threshold of 5.
Fig 5
Fig 5
Activities of iModulons known to be related to extracellular polymer synthesis. (A) A schematic diagram of gene functions in the three iModulons (Curli-1, cellulose, and biofilm) related to extracellular polymer synthesis. (B-D) Activity comparisons of between two of the three iModulons: (B) Curli-1 vs cellulose; (C) biofilm vs cellulose; (D) biofilm vs Curli-1. Black lines and grey dotted lines indicate correlations among the 36 samples and the entire samples, respectively. Pearson correlations (R) and corresponding P-values were given. (E-G) Time-course relative activities of (E) the Curli-1, (F) cellulose, and (G) biofilm iModulons compared with their activities in the C-limiting condition at 3 h. iM, imodulons.

Similar articles

References

    1. Nyström T. 2004. Stationary-phase physiology. Annu Rev Microbiol 58:161–181. doi:10.1146/annurev.micro.58.030603.123818 - DOI - PubMed
    1. Jaishankar J, Srivastava P. 2017. Molecular basis of stationary phase survival and applications. Front Microbiol 8:2000. doi:10.3389/fmicb.2017.02000 - DOI - PMC - PubMed
    1. Sastry AV, Gao Y, Szubin R, Hefner Y, Xu S, Kim D, Choudhary KS, Yang L, King ZA, Palsson BO. 2019. The Escherichia coli transcriptome mostly consists of independently regulated modules. Nat Commun 10:5536. doi:10.1038/s41467-019-13483-w - DOI - PMC - PubMed
    1. Lim HG, Rychel K, Sastry AV, Bentley GJ, Mueller J, Schindel HS, Larsen PE, Laible PD, Guss AM, Niu W, Johnson CW, Beckham GT, Feist AM, Palsson BO. 2022. Machine-learning from Pseudomonas putida KT2440 transcriptomes reveals its transcriptional regulatory network. Metab Eng 72:297–310. doi:10.1016/j.ymben.2022.04.004 - DOI - PubMed
    1. Saelens W, Cannoodt R, Saeys Y. 2018. A comprehensive evaluation of module detection methods for gene expression data. Nat Commun 9:1090. doi:10.1038/s41467-018-03424-4 - DOI - PMC - PubMed

MeSH terms