. 2025 Jan 2;19(1):wrae257.
doi: 10.1093/ismejo/wrae257.

Diversification of single-cell growth dynamics under starvation influences subsequent reproduction in a clonal bacterial population

Affiliations

Diversification of single-cell growth dynamics under starvation influences subsequent reproduction in a clonal bacterial population

Sotaro Takano et al. ISME J. .

Abstract

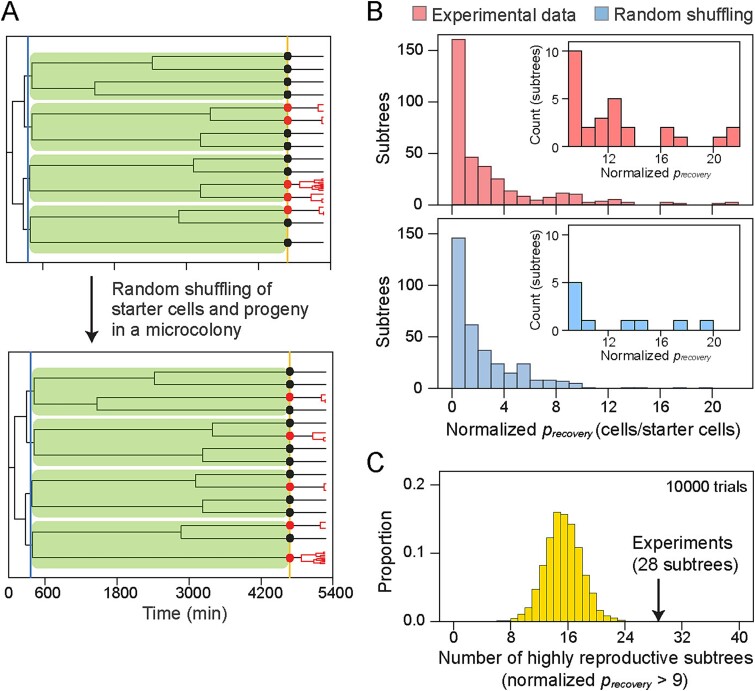
Most of the microbes in nature infrequently receive nutrients and are thus in slow- or non-growing states. How quickly they can resume their growth upon an influx of new resources is crucial to occupy environmental niches. Isogenic microbial populations are known to harbor only a fraction of cells with rapid growth resumption, yet little is known about the physiological characteristics of those cells and their emergence in the population. Here, we tracked growth of individual Escherichia coli cells in populations under fluctuating nutrient conditions. We found that shifting from high- to low-nutrient conditions caused stalling of cell growth with few cells continuing to divide extremely slowly, a process which was dependent on lipid turnover. Resuming high-nutrient inflow after low-nutrient conditions resulted in cells resuming growth and division, but with different lag times and leading to varying progeny. The history of cell growth during low-nutrient but not high-nutrient conditions was determinant for resumption of growth, which cellular genealogy analysis suggested to originate from inherited physiological differences. Our results demonstrate that cellular growth dynamics become diverse by nutrient limitations, under which a fraction of cells experienced a particular growth history can reproduce progeny with new resources in the future.

Keywords: growth dynamics; single cell; starvation; time-lapse imaging.


Conflict of interest statement

The authors declare no competing interests.

Figures

Figure 1
Figure 1
Heterogeneous growth dynamics in the low-nutrient period. (A) Time-lapse microscopic images of an E. coli microcolony from high-nutrient (t = 0–360 min) to low-nutrient (t = 360–4680 min) periods. We obtained mask images from sfGFP fluorescence images to quantify cell area (μm2). A subpopulation (designated subtree) derived from a single cell present at t = 360 min is indicated in the bottom images. (B) A representative lineage tree of a single microcolony. The tree is created by using time-lapse data of (A) and derived from a single cell at the start of the high-nutrient period. In a context of the tree, a cell is defined as a branch from its birth to division (green line). A subtree is a subpopulation derived from a cell at a given time point. The subtree shown in (A) is illustrated in orange lines. Vertical lines correspond to the timing when nutritional conditions were switched. (C) Growth curves of all 40 microcolonies obtained from two individual experiments. The size (i.e. area occupied by cells) of each microcolony S(t) compared to its initial size S(t0) is plotted over time on a log scale. A blue vertical line shows the timing of the shift from high- to low-nutrient periods (t = 360 min). (D) Coefficient of variation (CV) in size increase rate of cells within a microcolony. The average size increase rate of each cell (rcell) was calculated from its birth to division (or start or end of each period if birth or division events did not occur), and then the CV was calculated in a microcolony for high-nutrient and -poor periods separately. (E) CV in size increase rate within cousin subtrees. As the criteria in Fig. S6, 15 and 30 sets of cousin subtrees from 40 microcolonies were analyzed for high- and low-nutrient periods, respectively. Asterisks indicate the statistical significance level of Wilcoxon rank-sum test (**, P < . 01).
Figure 2
Figure 2
Heterogeneous reproduction and growth history. (A) A schematic illustration of the analysis. We observed regrowth of starter cells present at the beginning of the recovery period (encircled by dotted line) and analyzed their lag times τ (time to first cell division) and progeny numbers in the recovery period (precovery). Starter cells were categorized into three groups based on their regrowth capacity: Non-regrower (gray), precovery = 0; normal-regrower (red), 0 < precovery ≤ 7; hyper-regrower (orange), precovery > 7. Growth histories of starter cells were analyzed retrospectively (dotted arrows), where we traced back the growth of each starter cell from the end of the low-nutrient period and estimated “past” size increase rates (rlineage) in high- and low-nutrient periods. (B) Distribution of precovery in starter cells. A total of 549 starter cells (in 28 microcolonies from one of the two independent experiments) were used for the analysis. (C) Sorting of starter cells in descending order of precovery. The same data as in (B) was used. A curve indicates the cumulative proportion of total progeny. Hyper-regrowers and normal-regrowers are indicated in orange and red bars, respectively. Note that progeny cells from hyper-regrowers cover almost 50% of total progeny. (D) and (E) Comparison of growth histories among starter cells. Starter cells are categorized into the three groups, and their past rlineage in the high-nutrient period (t = 0–360 min) (D), Day 1 (t = 360–1800 min), Day 2 (t = 1800–3240 min), and Day 3 (t = 3240–4680 min) of the low-nutrient period (E) are separately plotted. The same data as in (B) was used. Median is shown as a thick horizontal line in each box. Alphabets show statistical significance groups according to Kruskal Wallis test followed by Steel-Dwass post hoc test (P < .05). n.s. means that no significantly different pairs exist.
Figure 3
Figure 3
History-dependent growth resumption after the shorter low-nutrient period. (A) Reproduction of starter cells (precovery) after 1 day of the low-nutrient period. A total of 471 starter cells (in 25 microcolonies from one of the two independent experiments) were sorted in descending order of precovery. All configurations are same as Fig. 2C. (B) and (C) Comparison of the past rlineage in three types of starter cells. The rlineage in the high-nutrient (t = 0–360 min) (B) and the low-nutrient (t = 360–1800 min) (C) periods among the 471 lineages are displayed. Median is shown as thick black line in each box. Alphabets show statistical significance groups according to Kruskal Wallis test followed by Steel-Dwass post hoc test (P < .05). n.s. means that no significantly different pairs exist.
Figure 4
Figure 4
Inheritance of the regrowth capability. (A) A schematic illustration of random shuffling of starter cells and their progeny. Subtrees derived from single cells presented at the onset of low-nutrient were shaded. While keeping the structure of subtrees, all the starter cells (black and red circles) with their progeny are randomly shuffled within each microcolony. (B) Distributions of normalized precovery of subtrees before and after random shuffling. The random shuffling was performed in each microcolony, and shuffled data from 40 microcolonies were merged. A representative distribution of normalized precovery after the shuffling (blue bars) is shown with the experimental data (red bars). Each inset is an enlarged view of the higher part of the distribution (i.e. normalized precovery > 9, which is 1.5 times of quartile range from the 3/4 quantile in experimental data). (C) Distribution of the number of highly reproductive subtrees (normalized precovery > 9) in random shuffling data (10 000 trials). A black arrow indicates the number of highly reproductive subtrees observed in experiments.
Figure 5
Figure 5
Effect of the acyl-CoA dehydrogenase (FadE) disruption on cell growth and subsequent reproduction in the recovery period. (A) Fatty acid β-oxidation pathway in E. coli. FadE is the first enzyme to break down a long-chain acyl-CoA to acetyl-CoA. (B) Growth curves of E. coli WT (black) and ΔfadE (purple) microcolonies. The size of the microcolony S(t) compared to its initial size S(t0) is plotted over time on a log scale. Here we set t0 to the beginning of each period (high-nutrient, t = 0 min; low-nutrient, t = 360 min). Average growth curves are indicated solid lines, and their 95% bootstrap confidence intervals are shaded. (C) Time-lapse fluorescence images of E. coli microcolonies from high-nutrient (t ≤ 360 min) to low-nutrient (t ≥ 360 min) periods in WT and ΔfadE strains. (D) Comparison of size increase rates of cells (rcell) in high- and low-nutrient periods. rcell was calculated from its birth to division (or start or end of each period if birth or division events did not occur). Data from all 40 (WT) and 18 (ΔfadE) microcolonies are shown. Statistical significance levels estimated by Wilcoxon rank sum test are indicated (**, P < .01; n.s., not significant). (E) Proportion of starter cells that divided at least once in the recovery period. In total, 815 WT and 626 ΔfadE starter cells obtained from 40 and 18 microcolonies, respectively, were analyzed. Error bars indicate 95% bootstrap confidence intervals.

Similar articles

References

    1. Stearns SC. Trade-offs in life-history evolution. Funct Ecol 1989;3:259–68. 10.2307/2389364 - DOI
    1. Levins R. Evolution in Changing Environments; some Theoretical Explorations. Prinston: Princeton University Press, 1968, 10.1515/9780691209418. - DOI
    1. Ferenci T. Trade-off mechanisms shaping the diversity of bacteria. Trends Microbiol 2016;24:209–23. 10.1016/j.tim.2015.11.009 - DOI - PubMed
    1. Shoval O, Sheftel H, Shinar Get al. . Evolutionary trade-offs, Pareto optimality, and the geometry of phenotype space. Science 2012;336:1157–60. 10.1126/science.1217405 - DOI - PubMed
    1. Colwell RR, Brayton PR, Grimes DJet al. . Viable but non-culturable vibrio cholerae and related pathogens in the environment: implications for release of genetically engineered microorganisms. Nat Biotechnol 1985;3:817–20. 10.1038/nbt0985-817 - DOI

MeSH terms

LinkOut - more resources