. 2025 Jan;31(1):75-85.
doi: 10.3201/eid3101.240737.

Social Contact Patterns and Age Mixing before and during COVID-19 Pandemic, Greece, January 2020-October 2021

Social Contact Patterns and Age Mixing before and during COVID-19 Pandemic, Greece, January 2020-October 2021

Vasiliki Engeli et al. Emerg Infect Dis. 2025 Jan.

Abstract

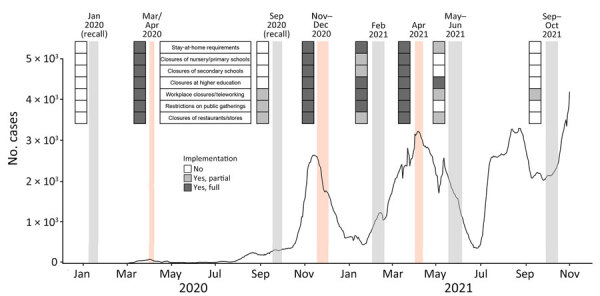
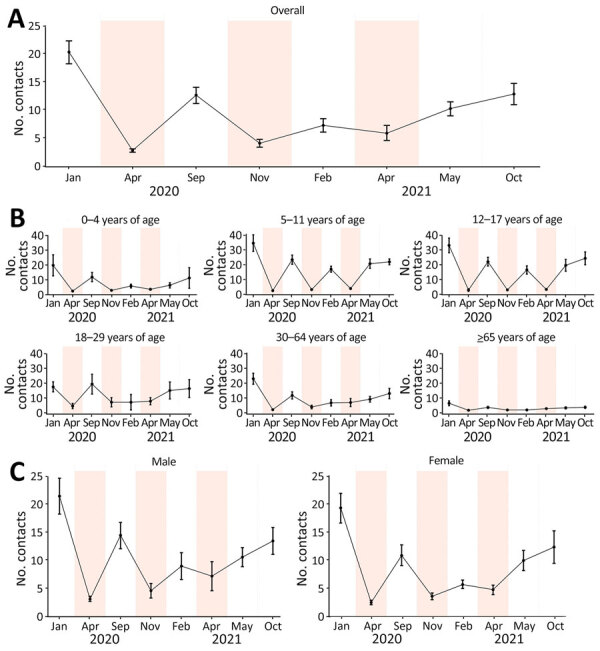
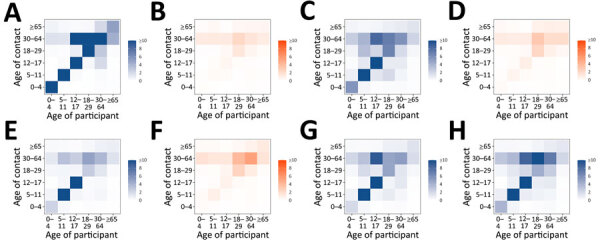
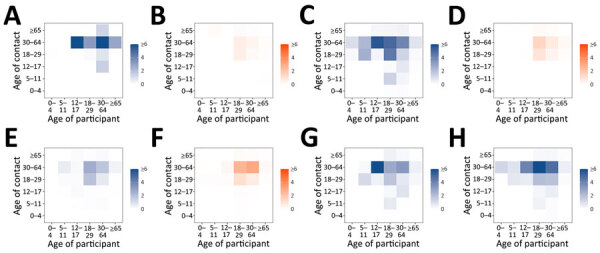
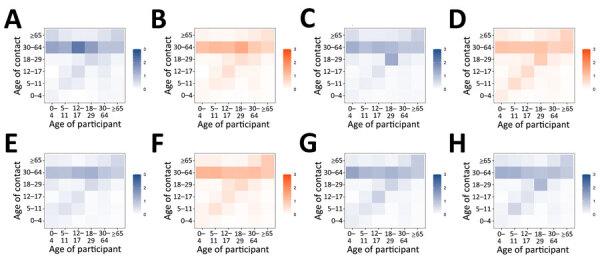
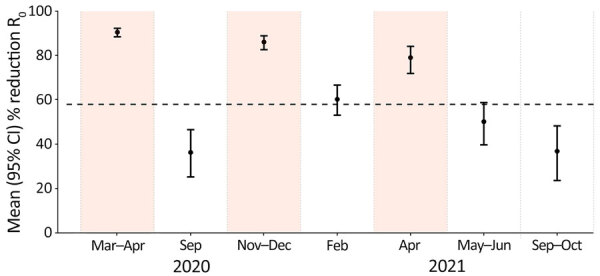
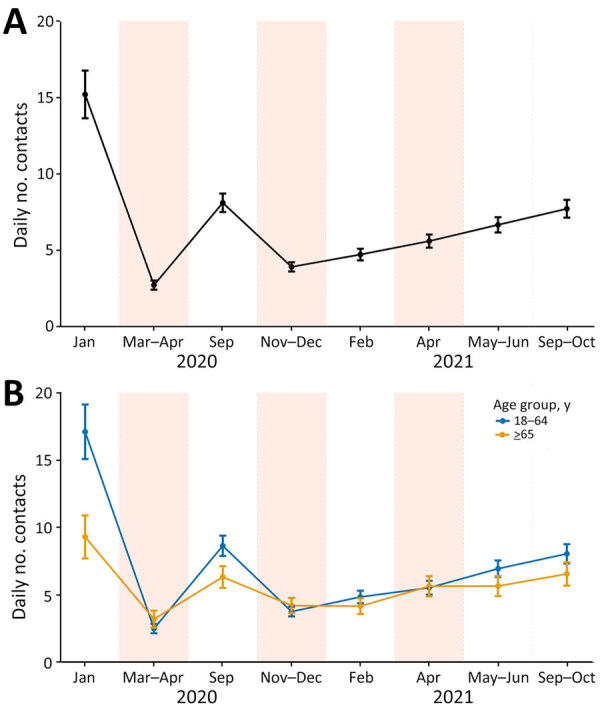
We collected social contact data in Greece to measure contact patterns before (January 2020) and during the COVID-19 pandemic (March 2020-October 2021) and assess the effects of social distancing over time. During lockdowns, mean daily contacts decreased to 2.8-5.9 (mean prepandemic 20.4). Persons >65 years of age retained the fewest contacts during the pandemic (2.1-4.1). Compared with the first lockdown (March-April 2020), the second lockdown (November-December 2020) and third lockdown (April 2021) showed higher numbers of contacts (incidence rate ratio 1.50 [95% CI 1.27-1.76] in second lockdown and 2.19 [95% CI 1.86-2.58] in third lockdown). In 2021, an increase in contacts was apparent, which persisted during the April 2021 lockdown among persons 18-64 years of age. Our study provides evidence of the waning observance of physical distancing. Effective risk communication alongside targeted social distancing could offer alternatives to repeated lockdowns.

Keywords: COVID-19; Greece; SARS-CoV-2; basic reproduction number; coronavirus disease; pandemic; prevention and control; respiratory infections; severe acute respiratory syndrome coronavirus 2; social distancing; surveys and questionnaires; transmission; viruses; zoonoses.


Figures

Figure 1
Figure 1
Seven-day moving average of laboratory-confirmed COVID-19 cases by date of sampling and key community measures during social contact data collection periods in study of social contact patterns and age mixing before and during COVID-19 pandemic, Greece, January 2020–October 2021. Data on COVID-19 cases were extracted from the daily reports of the National Public Health Organization. Social contact data collection periods are illustrated with shaded zones (light orange indicates lockdown periods, gray indicates prepandemic period and periods with relaxed measures). Key community measures implemented during the study periods are indicated on the left of each zone. The color of each cell represents the extent to which each community measure was implemented.
Figure 2
Figure 2
Mean daily number of recorded social contacts per participant in study of social contact patterns and age mixing before and during COVID-19 pandemic, Greece, January 2020–October 2021. Data are shown for 8 social contact data collection periods overall (A), by age group (B), and by sex (C). Estimates have been adjusted for the age and sex distribution of the population of Greece by region. Error bars mark 95% CIs. Shaded areas indicate lockdown periods.
Figure 3
Figure 3
Age-specific contact matrices of all contacts in study of social contact patterns and age mixing before and during COVID-19 pandemic, Greece, January 2020–October 2021. A) January 2020; B) March–April 2020; C) September 2020; D) November–December 2020; E) February 2021; F) April 2021; G) May–June 2021; H) September–October 2021. Each cell represents the average daily number of reported contacts, stratified by the age group of the participants and their corresponding contacts. Gradient palettes were used to color contact matrices (orange indicates lockdown periods, blue indicates prepandemic period and periods with relaxed measures).
Figure 4
Figure 4
Age-specific contact matrices at work in study of social contact patterns and age mixing before and during COVID-19 pandemic, Greece, January 2020–October 2021. A) January 2020; B) March–April 2020; C) September 2020; D) November–December 2020; E) February 2021; F) April 2021; G) May–June 2021; H) September–October 2021. Each cell represents the average daily number of reported contacts, stratified by the age group of the participants and their corresponding contacts. Gradient palettes were used to color contact matrices (orange indicates lockdown periods, blue indicates prepandemic period and periods with relaxed measures).
Figure 5
Figure 5
Age-specific contact matrices at home in study of social contact patterns and age mixing before and during COVID-19 pandemic, Greece, January 2020–October 2021. A) January 2020; B) March–April 2020; C) September 2020; D) November–December 2020; E) February 2021; F) April 2021; G) May–June 2021; H) September–October 2021. Each cell represents the average daily number of reported contacts, stratified by the age group of the participants and their corresponding contacts. Gradient palettes were used to color contact matrices (orange indicates lockdown periods, blue indicates prepandemic period and periods with relaxed measures).
Figure 6
Figure 6
Mean reduction in R0 caused by physical distancing measures during COVID-19 pandemic (March 2020–October 2021) compared with prepandemic period (January 2020) in study of social contact patterns and age mixing before and during COVID-19 pandemic, Greece. R0 reduction was obtained by comparing social contacts data from each study period during the pandemic to the prepandemic period (January 2020). Error bars indicate 95% CIs. Shaded areas indicate lockdown periods. Dashed horizontal line indicates the minimum reduction needed to bring R0 to <1, assuming R0 is equal to 2.38 (15). R0, basic reproduction number.
Figure 7
Figure 7
Adjusted average predictions of the number of contacts of adult participants in study of social contact patterns and age mixing before and during COVID-19 pandemic, Greece, January 2020–October 2021 (N = 6,270). Data are shown for A) study period and B) study period according to the age group of participants. Results from negative binomial generalized linear mixed models with random intercepts at the individual level fitted on social contact data collected across 8 periods in Greece through cross-sectional surveys. Error bars indicate 95% CIs. Shaded areas indicate lockdown periods.

Similar articles

References

    1. Bell DM; World Health Organization Working Group on International and Community Transmission of SARS. Public health interventions and SARS spread, 2003. Emerg Infect Dis. 2004;10:1900–6. 10.3201/eid1011.040729 - DOI - PMC - PubMed
    1. Davis BM, Markel H, Navarro A, Wells E, Monto AS, Aiello AE. The effect of reactive school closure on community influenza-like illness counts in the state of Michigan during the 2009 H1N1 pandemic. Clin Infect Dis. 2015;60:e90–7. 10.1093/cid/civ182 - DOI - PubMed
    1. European Centre for Disease Prevention and Control. Considerations relating to social distancing measures in response to COVID-19–second update. Stockholm: The Centre; 2020.
    1. Hens N, Ayele GM, Goeyvaerts N, Aerts M, Mossong J, Edmunds JW, et al. Estimating the impact of school closure on social mixing behaviour and the transmission of close contact infections in eight European countries. BMC Infect Dis. 2009;9:187. 10.1186/1471-2334-9-187 - DOI - PMC - PubMed
    1. Mossong J, Hens N, Jit M, Beutels P, Auranen K, Mikolajczyk R, et al. Social contacts and mixing patterns relevant to the spread of infectious diseases. PLoS Med. 2008;5:e74. 10.1371/journal.pmed.0050074 - DOI - PMC - PubMed

LinkOut - more resources