. 2024 Dec 23:13:RP94884.
doi: 10.7554/eLife.94884.

A novel human pluripotent stem cell gene activation system identifies IGFBP2 as a mediator in the production of haematopoietic progenitors in vitro

Affiliations

A novel human pluripotent stem cell gene activation system identifies IGFBP2 as a mediator in the production of haematopoietic progenitors in vitro

Paolo Petazzi et al. Elife. .

Abstract

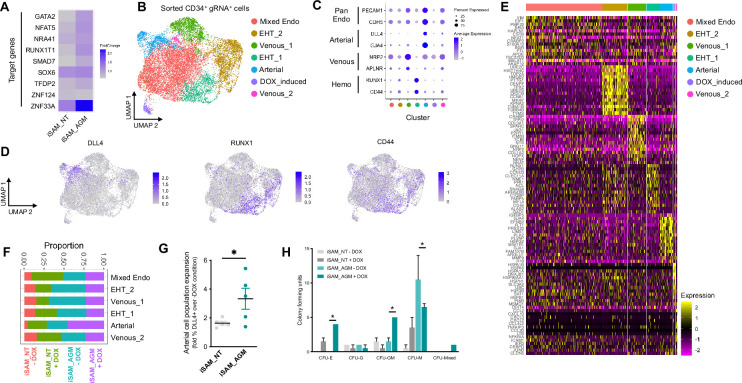
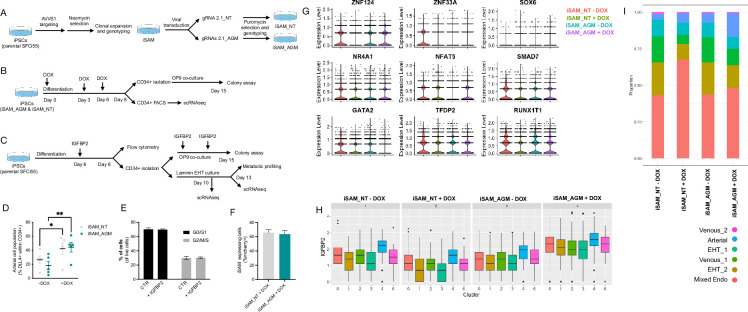
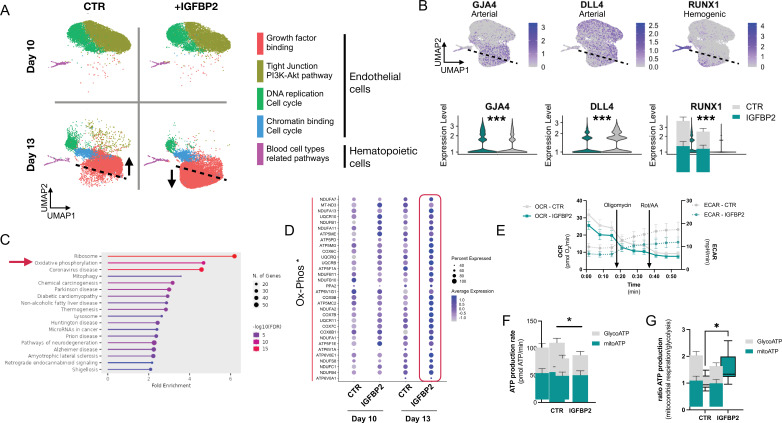
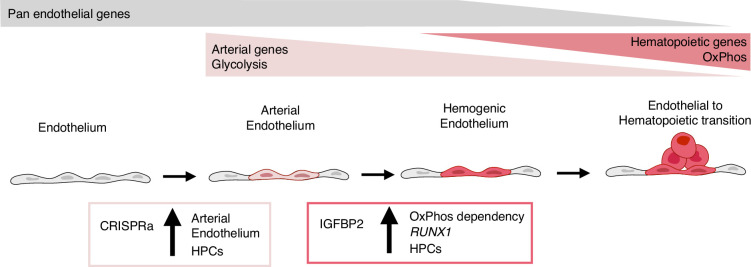
A major challenge in the stem cell biology field is the ability to produce fully functional cells from induced pluripotent stem cells (iPSCs) that are a valuable resource for cell therapy, drug screening, and disease modelling. Here, we developed a novel inducible CRISPR-mediated activation strategy (iCRISPRa) to drive the expression of multiple endogenous transcription factors (TFs) important for in vitro cell fate and differentiation of iPSCs to haematopoietic progenitor cells. This work has identified a key role for IGFBP2 in developing haematopoietic progenitors. We first identified nine candidate TFs that we predicted to be involved in blood cell emergence during development, then generated tagged gRNAs directed to the transcriptional start site of these TFs that could also be detected during single-cell RNA sequencing (scRNAseq). iCRISPRa activation of these endogenous TFs resulted in a significant expansion of arterial-fated endothelial cells expressing high levels of IGFBP2, and our analysis indicated that IGFBP2 is involved in the remodelling of metabolic activity during in vitro endothelial to haematopoietic transition. As well as providing fundamental new insights into the mechanisms of haematopoietic differentiation, the broader applicability of iCRISPRa provides a valuable tool for studying dynamic processes in development and for recapitulating abnormal phenotypes characterised by ectopic activation of specific endogenous gene expression in a wide range of systems.

Keywords: CRISPR activation; developmental biology; haematopoiesis; human; pluripotent stem cells; regenerative medicine; stem cells.


Conflict of interest statement

PP, TV, FL, HM, AM, HT, MS, NR, LF, PM, AF No competing interests declared

Figures

Figure 1.
Figure 1.. Comparison of in vitro induced pluripotent stem cell (iPSC)-derived and in vivo aorta-gonad-mesonephros (AGM)-derived endothelial cells identifies nine differentially expressed transcription factors.
(A) Schematic of the analytic pipeline used to identify the target genes. (B) Integrative analysis of single-cell transcriptome of in vitro-derived endothelial (IVD_Endo) and haematopoietic cells (IVD_HPCs) with in vivo developed endothelial cells (venous, vEC; arterial, aEC; arterial haemogenic, HECs) from human embryos (CS12-CS14) visualised on UMAP dimensions. (C) Target genes expression level showing higher expression in arterial haemogenic endothelium in vivo than in vitro-derived cells.
Figure 1—figure supplement 1.
Figure 1—figure supplement 1.. Gene expression profile of the target genes in an additional human AGM dataset.
(A) Single-cell transcriptomic analysis of developing aorta-gonad-mesonephros (AGM) collected from human embryos at Carnegie stages 14 and 15 enriched for CD31+ and CD34+ cells from Calvanese et al., 2022, Nature. Arterial haemogenic endothelium, dashed line, is identified by the colocalisation of DLL4 and RUNX1. (B) Gene expression analysis of the nine selected target genes in the developing human aorta, showing their expression in the haemogenic endothelium.
Figure 2.
Figure 2.. The inducible SAM (iSAM) cassette successfully mediates activation of endogenous gene expression upon doxycycline (DOX) induction.
(A) Schematic of the iSAM cassette containing the TET-on system under the control of EF1α and dCAS9-P2A-MS2-p65-HSF1-T2A-mCherry under the rTTA responsive elements, separated by genetic silencer and flanked by AAVS1 specific homology arms. (B) RUNX1C gene expression activation after transient transfection of the iSAM plasmid and gRNAs in presence or absence of DOX in human induced pluripotent stem cell (iPSC) line (n=3 from independent transfections). (C) RUNX1 protein expression upon iSAM activation after transient transfection of the iSAM plasmid and gRNAs with DOX in human iPSC line detected by immunostaining. (D) Expression of the iSAM cassette reported by mCherry tag during the differentiation protocol, the representative images (bright field - BF, and fluorescence) show embryoid bodies at day 3 of differentiation. (E) Schematic of the gRNA 2.1 containing the capture sequence for detection during the single-cell RNA sequencing (scRNAseq) pipeline. (F) RUNX1C gene activation level obtained using either the gRNA 2.0 or 2.1 backbone (n=3 from independent transfections of the 4 different gRNAs). (G) Statistical analysis of the gRNAs activation level showing no significant variation following addition of the capture sequence (n=3 for each of the 4 different gRNAs).
Figure 2—figure supplement 1.
Figure 2—figure supplement 1.. Functional validation of the iSAM plasmid.
(A) Schematic of the inducible SAM (iSAM)-mediated activation of RUNX1C by transient transfection in HeLa cells with the iSAM vector and the RUNX1C gRNA; fluorescent microscopy demonstrating the expression of the mCherry tag. (B) Linear regression of RUNX1C RNA expression in relation to the concentration of doxycycline (DOX) added to HeLa cells (n=3). (C) Schematic of the iSAM-mediated activation of the human embryonic stem cells (hESCs) RUNX1C-GFP reporter cell line by transient transfection of the iSAM vector and RUNX1C gRNA. (D) Flow cytometry analysis of RUNX1C-GFP expression and mCherry in the hESCs RUNX1C-GFP reporter line after exposure to different DOX concentrations. (E) Linear regression of the mCherry tag expression in relation to the concentration of DOX added (in ng/ml) to the hESCs RUN1C-GFP reporter line (n=3). (F) Percentage of activated cells (GFP+mCherry+) in the presence of different concentrations of DOX (in ng/ml) (n=3). (G) RUNX1C single-cell expression level analysed by flow cytometry in hESCs exposed to different DOX concentrations (n=4).
Figure 2—figure supplement 2.
Figure 2—figure supplement 2.. Validation of the iSAM hiPSC cell lines.
(A) PCR screening of the clones obtained from the AAVS1 targeting showing specific integration with amplification across the 5’ end, and (B) the wild-type (WT) locus. Clone 3.13 was selected for the study and referred to as inducible SAM (iSAM). (C) Flow cytometry analysis of mCherry+ cells upon DOX addition in human induced pluripotent stem cells (hiPSCs) with iSAM targeted into the AAVS1 locus following maintenance. (D) Flow cytometry analysis of the expression of the mCherry tag, in hiPSCs with iSAM targeted into the AAVS1 locus, following 48 hr sodium butyrate and DOX treatment at different concentrations. (E) Flow cytometry analysis of the expression of the mCherry tag upon DOX addition, in hiPSCs with iSAM targeted into the AAVS1 locus, maintained in the presence of 500 μM sodium butyrate. (F) The cell count of iPSCs maintained in the presence of sodium butyrate shows no significant differences (Mann-Whitney unpaired t-test, p=0.45). (G) Cell viability was comparable when iPSCs were maintained in control conditions or in the presence of sodium butyrate (Mann-Whitney unpaired t-test, p=0.46). (H) PCR screening for the integration of the gRNA into the genome of the iSAM hiPSCs line (from left to right: iSAM line before infection, after infection with non-targeting gRNA, after infection with aorta-gonad-mesonephros [AGM] library and water negative control). (I) Sanger sequencing trace of the amplicons obtained from the iSAM line infected with the non-targeting gRNA (top) or the AGM library (bottom).
Figure 3.
Figure 3.. Single-cell RNA sequencing (scRNAseq) in combination with CRISPR activation identifies arterial cell type and functional haematopoietic expansion in association with activation of the nine target genes.
(A) Gene expression profile of target genes following target genes’ activation, heatmap shows the expression level of the target genes in the iSAM_NT and iSAM_AGM treated with doxycycline (DOX) following normalisation on the -DOX control. (B) Dimension reduction and clustering analysis of the scRNAseq data following activation, filtered on cells where the gRNA expression was detected. (C) Arterial (GJA4, DLL4), venous (NRP2, APLNR), and haemogenic marker (CD44, RUNX1) expression distribution in the clusters indicated by the colour. (D) Expression distribution visualised on the UMAP plot showing the location of arterial cells marked by DLL4, and haemogenic endothelium marked by CD44 and RUNX1. (E) Heatmap of the top 15 marker genes for each of the clusters. (F) Contribution of the different libraries to the clusters showing that arterial cell cluster is overrepresented in the iSAM_AGM treated with DOX, compared to the other libraries. (G) Expansion of the arterial population assessed by the membrane marker expression of DLL4+ following targets’ activation, quantified by flow cytometry at day 8 of differentiation. (Data are normalised on the iSAM_NT+DOX sample, n=5 independent differentiations, *p=0.0417 paired t-test.) (H) Colony-forming potential of the suspension progenitor cells derived from the two lines treated with or without DOX following OP9 coculture activation, data show the colony obtained for 104 CD34+ input equivalent (n=3 from independent differentiations *p<0.05, Tukey’s two-way ANOVA).
Figure 3—figure supplement 1.
Figure 3—figure supplement 1.. Experimental design and further characterisation of the activation results.
(A) Schematic of the derivation of the inducible SAM (iSAM) cell line by ZNFs mediated targeting of the AAVS1 locus and the subsequent derivation of the iSAM_NT (containing the non-targeting control gRNA) and iSAM_AGM (containing the gRNAs for the target genes) by viral transduction of the gRNAs. (B) Schematic of the differentiation protocol with activation of the target genes, used for both the control line iSAM_NT and iSAM_AGM. (C) Schematic of the IGFBP2 functional validation experiment. (D) Expansion of the arterial population marker by membrane expression of DLL4+ following targets’ activation, quantified by flow cytometry at day 8 of differentiation (*p=0.0190, **p=0.0011, Sidak’s two-way ANOVA). (E) Flow cytometry analysis of the cell cycle analysis of suspension progenitor cells was obtained following the OP9 coculture of cells treated with IGFBP2 and control at day 13. (F) iSAM expressing cells at day 8 of differentiation upon doxycycline (DOX) treatment. (G) Target genes’ expression profile across the different libraries, the colour legend for the libraries is on the top right. (H) IGFBP2 expression profile across the cell clusters and in the cell lines and conditions indicated in the title (cluster legend same as in I). (I) Contribution of each of the libraries to the cell clusters, grouped by libraries (cluster legend at the bottom).
Figure 4.
Figure 4.. IGFBP2 addition to the in vitro differentiation leads to a higher number of functional haematopoietic progenitor cells.
(A) Violin plot of IGFBP2 expression profile in the arterial cells obtained from the different conditions, in the presence or absence of gRNAs and doxycycline (DOX). (B) Number of haematopoietic colonies obtained after coculture on OP9 in the presence or absence of IGFBP2 (n=3–4 from independent differentiations, **p=0.0080, Sidak’s two-way ANOVA). (C) Percentage of DLL4+ arterial cells differentiation within the CD34+ compartment analysed by flow cytometry in day 8 embryoid bodies (EBs) (n=4 from independent differentiations, two-way ANOVA, ns = p>0.99). (D) Expansion of haematopoietic progenitors analysed using markers’ expression on suspension progenitors derived after coculture of CD34+ cells onto OP9 support (data are expressed as fold over the CTR in the absence of IGFBP2; n=4 from independent differentiations, *p<0.02, Sidak’s two-way ANOVA). (E) Single-cell transcriptomic analysis of developing aorta-gonad-mesonephros (AGM) collected from human embryos at Carnegie stages14 and 15 enriched for CD31+ and CD34+ showing the IGFBP2 expression profile in vivo in the AGM.
Figure 5.
Figure 5.. IGFBP2 alters cell metabolism by inducing a reduction in glycolytic ATP production.
(A) Clustering analysis of the single-cell transcriptomic time course analysis of differentiating cells at day 10 and day 13 in the absence (CTR) or presence of IGFBP2. Arrows indicate the difference in the clustering due to the addition of IGFBP2 compared to control. (B) Expression profile of arterial markers, GJA4 and DLL4, and haemogenic marker RUNX1 (top - the dashed line shows the location of the shift in gene expression of cells treated with IGFBP2) and their expression profile in the endothelial cells cluster marked by growth factor binding in the absence (CTR) and in the presence of IGFBP2 (GJA4 p=1E–54, DLL4 p=1.2E–119, RUNX1 p=8.2E–163). (C) KEGG enrichment analysis of the genes upregulated at day 13 upon IGFBP2 treatment. The arrow shows the ranking of the oxidative phosphorylation pathway. (D) Dot plot showing the expression profile of the genes coding for the enzyme of the oxidative phosphorylation pathway. (E) Oxygen consumption rate (OCR) and extracellular acidification rate (ECAR) profile in cells at day 13 of differentiation reporting mitochondrial respiration and glycolysis, respectively. (F) ATP production rate divided by that deriving from glycolysis and from mitochondrial respiration, in cells treated with IGFBP2 and controls at day 13. (G) Ratio of the ATP production between glycolysis and mitochondrial respiration in cells treated with IGFBP2 and controls at day 13.
Figure 5—figure supplement 1.
Figure 5—figure supplement 1.. Additional analyses of the effect of IGFBP2 addition during in vitro differentiation.
(A) Dot plot showing the expression profile of the genes coding for the enzymes mediating glycolysis in CTR and IGFBP2-treated cells at day 10 and 13. (B) Dot plot showing the expression profile of the genes coding for the checkpoints of the glycolysis in CTR and IGFBP2-treated cells at days 10 and 13. (C) Percentage of cells expressing different markers following OP9 coculture of CD34+ cells (ns for all markers, Kruskall-Wallis one-way ANOVA). (D) OP9 cocultures of CD34+ DLL4+ and CD34+DLLL4- (scale bar indicates 50 μm), and in (E) their colony formation capacities following 1 week of OP9 coculture (mixed-effect analysis, Sidak’s post-test, ****p<0.0001, **p<0.01). (F) Cluster composition in cells treated with IGFBP2 data shows the composition at day 10 and day 13.
Figure 6.
Figure 6.. Model summarising the results.
During development, some endothelial cells undergo arterialisation, as identified by their arterial genes’ expression profile (e.g. DLL4). Arterial cells, characterised by high dependency on glycolysis, are expanded by our CRISPR activation approach, resulting in more blood production since these cells are the cell-of-origin of the haemogenic endothelium. Once arterial cells commit to haemogenic endothelium fate, they start to express haematopoietic genes (e.g. RUNX1); this process is enhanced by IGFBP2 via induction of both RUNX1 expression and increased dependency on oxidative phosphorylation, known to be important for the progression of the endothelial to haematopoietic transition.

Update of

  • doi: 10.1101/2024.01.14.575573
  • doi: 10.7554/eLife.94884.1
  • doi: 10.7554/eLife.94884.2

Similar articles

Cited by

References

    1. afidanza CRISPRa. swh:1:rev:a65690d5082d7e9d08827e9d766b28430e4335c3Software Heriatge. 2022 https://archive.softwareheritage.org/swh:1:dir:a128c50858298df5c9e333b9a...
    1. Azzoni E, Frontera V, Anselmi G, Rode C, James C, Deltcheva EM, Demian AS, Brown J, Barone C, Patelli A, Harman JR, Nicholls M, Conway SJ, Morrissey E, Jacobsen SEW, Sparrow DB, Harris AL, Enver T, de Bruijn MFTR. The onset of circulation triggers a metabolic switch required for endothelial to hematopoietic transition. Cell Reports. 2021;37:110103. doi: 10.1016/j.celrep.2021.110103. - DOI - PMC - PubMed
    1. Bertrand JY, Chi NC, Santoso B, Teng S, Stainier DYR, Traver D. Haematopoietic stem cells derive directly from aortic endothelium during development. Nature. 2010;464:108–111. doi: 10.1038/nature08738. - DOI - PMC - PubMed
    1. Böiers C, Carrelha J, Lutteropp M, Luc S, Green JCA, Azzoni E, Woll PS, Mead AJ, Hultquist A, Swiers G, Perdiguero EG, Macaulay IC, Melchiori L, Luis TC, Kharazi S, Bouriez-Jones T, Deng Q, Pontén A, Atkinson D, Jensen CT, Sitnicka E, Geissmann F, Godin I, Sandberg R, de Bruijn MFTR, Jacobsen SEW. Lymphomyeloid contribution of an immune-restricted progenitor emerging prior to definitive hematopoietic stem cells. Cell Stem Cell. 2013;13:535–548. doi: 10.1016/j.stem.2013.08.012. - DOI - PubMed
    1. Boisset J-C, van Cappellen W, Andrieu-Soler C, Galjart N, Dzierzak E, Robin C. In vivo imaging of haematopoietic cells emerging from the mouse aortic endothelium. Nature. 2010;464:116–120. doi: 10.1038/nature08764. - DOI - PubMed

MeSH terms

Substances

Associated data