

Programmed cell death pathways in lung adenocarcinoma: illuminating tumor drug resistance and therapeutic opportunities through single-cell analysis
- PMID: 39714518
- PMCID: PMC11666868
- DOI: 10.1007/s12672-024-01736-0
Programmed cell death pathways in lung adenocarcinoma: illuminating tumor drug resistance and therapeutic opportunities through single-cell analysis
Abstract
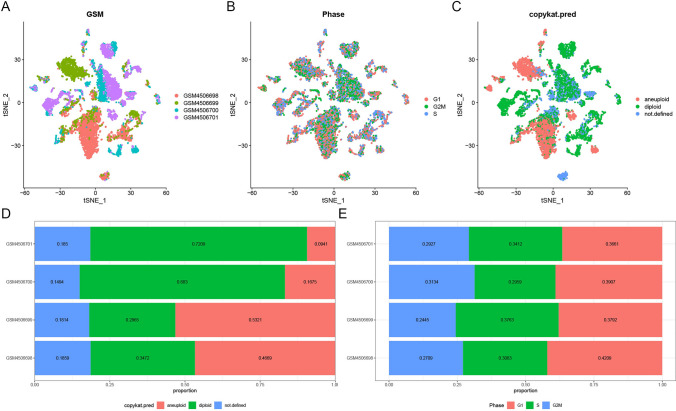
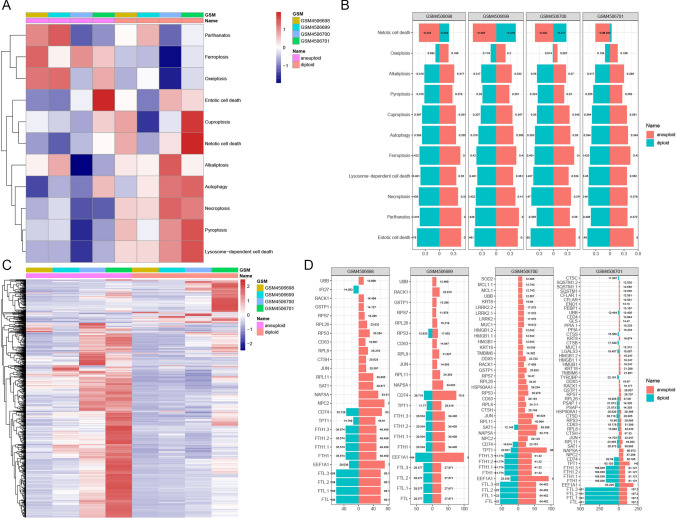
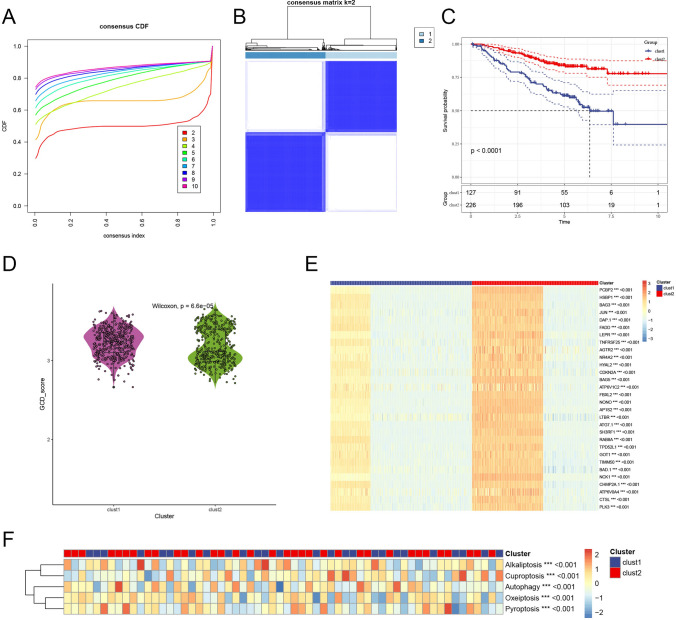
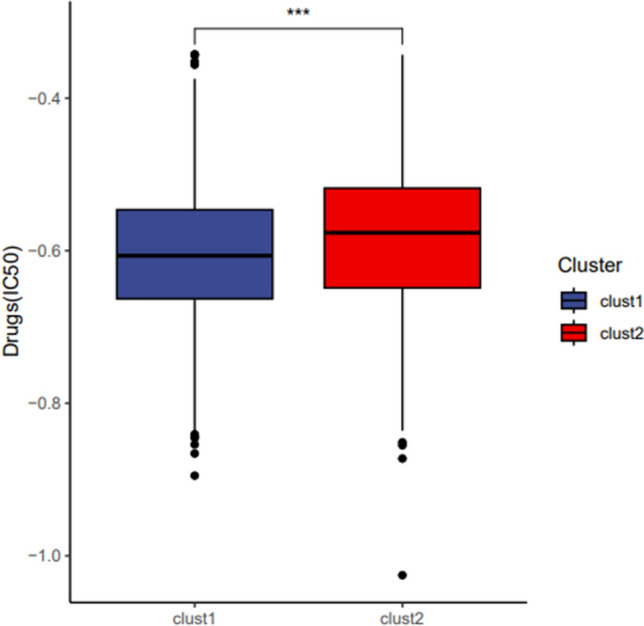
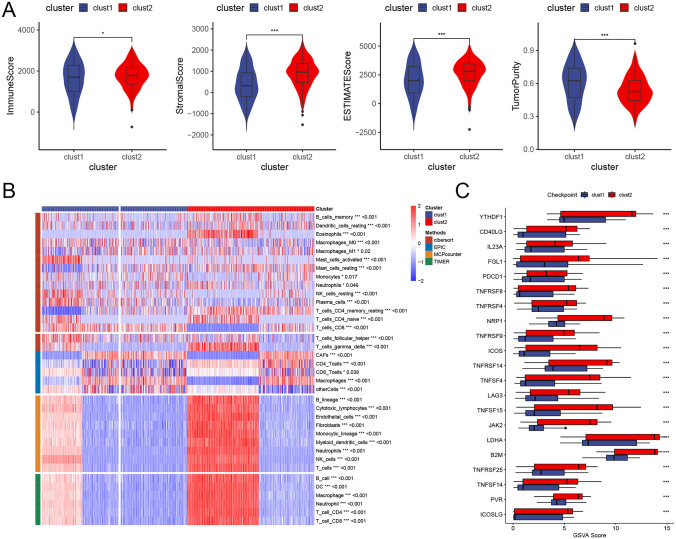
Lung adenocarcinoma (LUAD) is a major contributor to cancer-related deaths, distinguished by its pronounced tumor heterogeneity and persistent challenges in overcoming drug resistance. In this study, we utilized single-cell RNA sequencing (scRNA-seq) to dissect the roles of programmed cell death (PCD) pathways, including apoptosis, necroptosis, pyroptosis, and ferroptosis, in shaping LUAD heterogeneity, immune infiltration, and prognosis. Among these, ferroptosis and pyroptosis were most significantly associated with favorable survival outcomes, highlighting their potential roles in enhancing anti-tumor immunity. Distinct PCD-related LUAD subtypes were identified, characterized by differential pathway activation and immune cell composition. Subtypes enriched with cytotoxic lymphocytes and dendritic cells demonstrated improved survival outcomes and increased potential responsiveness to immunotherapy. Drug sensitivity analysis revealed that these subtypes exhibited heightened sensitivity to targeted therapies and immune checkpoint inhibitors, suggesting opportunities for personalized treatment strategies. Our findings emphasize the interplay between PCD pathways and the tumor microenvironment, providing insights into the mechanisms underlying tumor drug resistance and immune evasion. By linking molecular and immune features to clinical outcomes, this study highlights the potential of targeting PCD pathways to enhance therapeutic efficacy and overcome resistance in LUAD. These results contribute to a growing framework for developing precise and adaptable cancer therapies tailored to specific tumor characteristics.
Keywords: Drug resistance; Immune infiltration; Lung adenocarcinoma; Programmed cell death; Single-cell RNA sequencing; Therapeutic targets; Tumor heterogeneity.
© 2024. The Author(s).
Conflict of interest statement
Declarations. Ethics approval and consent to participate: Not applicable. Consent for publication: Not applicable. Competing interests: The authors declare no competing interests.
Figures
Similar articles
-
Prognostic Cell Death Index for Lung Adenocarcinoma: A Comprehensive Transcriptome-Based Analysis of Twelve Programmed Cell Death Pattern Genes.Front Biosci (Landmark Ed). 2024 Apr 1;29(4):135. doi: 10.31083/j.fbl2904135. Front Biosci (Landmark Ed). 2024. PMID: 38682187
-
Ferroptosis and WDFY4 as novel targets for immunotherapy of lung adenocarcinoma.Aging (Albany NY). 2023 Sep 19;15(18):9676-9694. doi: 10.18632/aging.205042. Epub 2023 Sep 19. Aging (Albany NY). 2023. PMID: 37728413 Free PMC article.
-
Integrated Genomics Reveal Potential Resistance Mechanisms of PANoptosis-Associated Genes in Acute Myeloid Leukemia.Mol Carcinog. 2025 May;64(5):801-815. doi: 10.1002/mc.23886. Epub 2025 Jan 27. Mol Carcinog. 2025. PMID: 39868611
-
Programmed cell death in tumor immunity: mechanistic insights and clinical implications.Front Immunol. 2024 Jan 12;14:1309635. doi: 10.3389/fimmu.2023.1309635. eCollection 2023. Front Immunol. 2024. PMID: 38283351 Free PMC article. Review.
-
Programmed Cell Death Tunes Tumor Immunity.Front Immunol. 2022 Mar 30;13:847345. doi: 10.3389/fimmu.2022.847345. eCollection 2022. Front Immunol. 2022. PMID: 35432318 Free PMC article. Review.
References
-
- Myers DJ, Wallen JM. Lung adenocarcinoma. In: StatPearls. 2024, StatPearls Publishing Copyright © 2024, StatPearls Publishing LLC.: Treasure Island (FL) ineligible companies. Disclosure: Jason Wallen declares no relevant financial relationships with ineligible companies.
-
- Yu Y, et al. Predicting potential therapeutic targets and small molecule drugs for early-stage lung adenocarcinoma. Biomed Pharmacother. 2024;174: 116528. - PubMed
-
- Kalinke L, Janes SM. Two phenotypes that predict prognosis in lung adenocarcinoma. Eur Respir J. 2022;60(1):2200569. - PubMed
LinkOut - more resources
Full Text Sources