. 2024 Dec 23;15(1):824.
doi: 10.1007/s12672-024-01713-7.

Machine learning-based identification of histone deacetylase-associated prognostic factors and prognostic modeling for low-grade glioma

Affiliations

Machine learning-based identification of histone deacetylase-associated prognostic factors and prognostic modeling for low-grade glioma

Keshan Wen et al. Discov Oncol. .

Abstract

Background: Low-grade glioma (LGG) is a slow-growing but invasive tumor that affects brain function. Histone deacetylases (HDACs) play a critical role in gene regulation and tumor progression. This study aims to develop a prognostic model based on HDAC-related genes to aid in risk stratification and predict therapeutic responses.

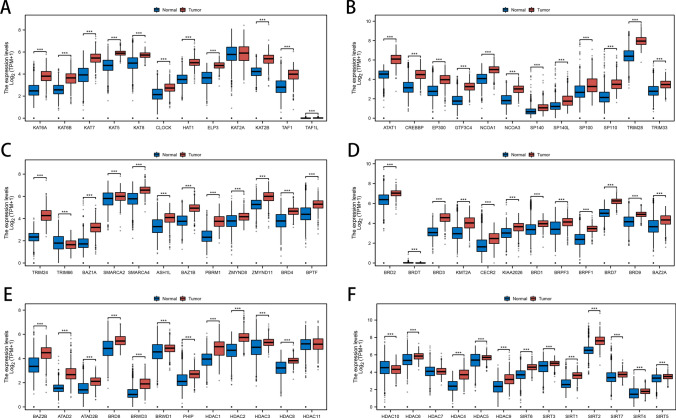
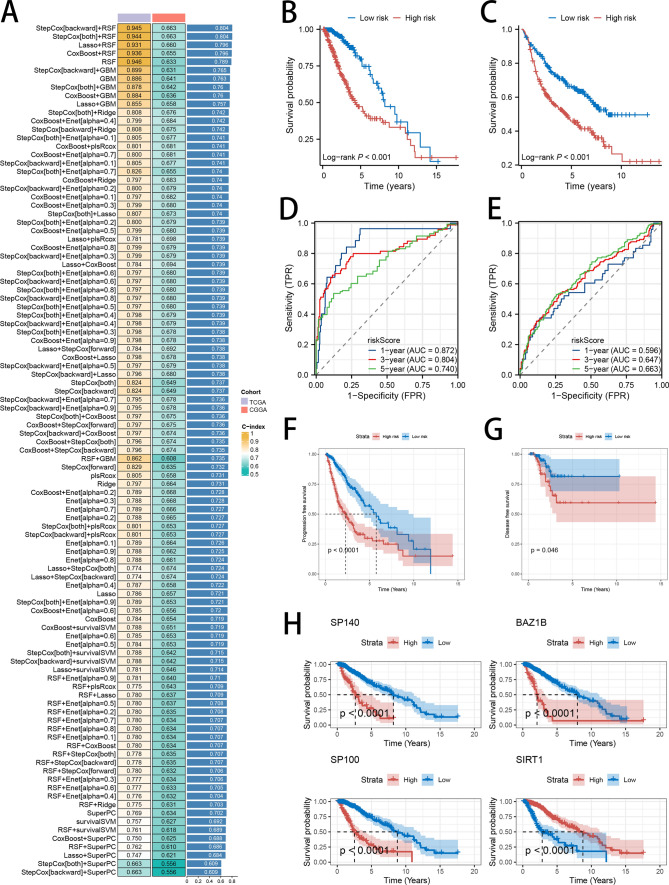
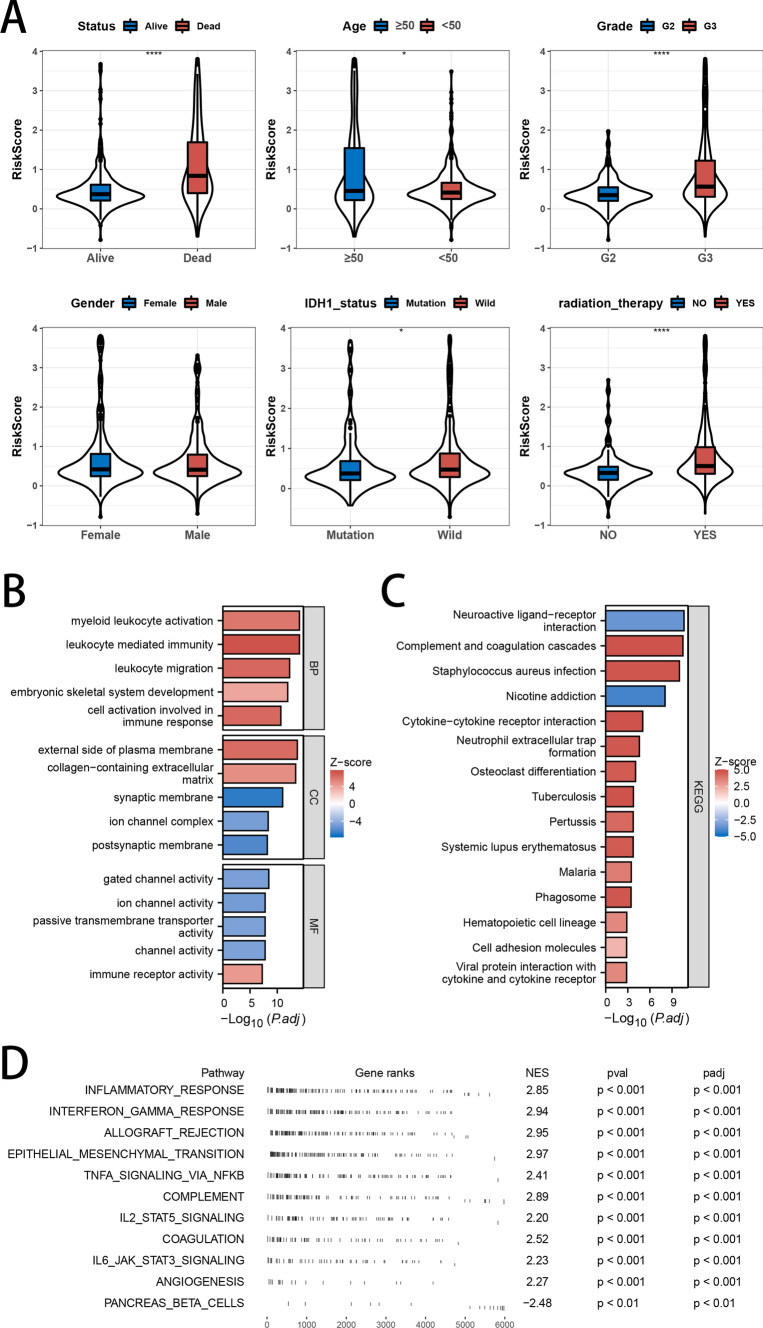
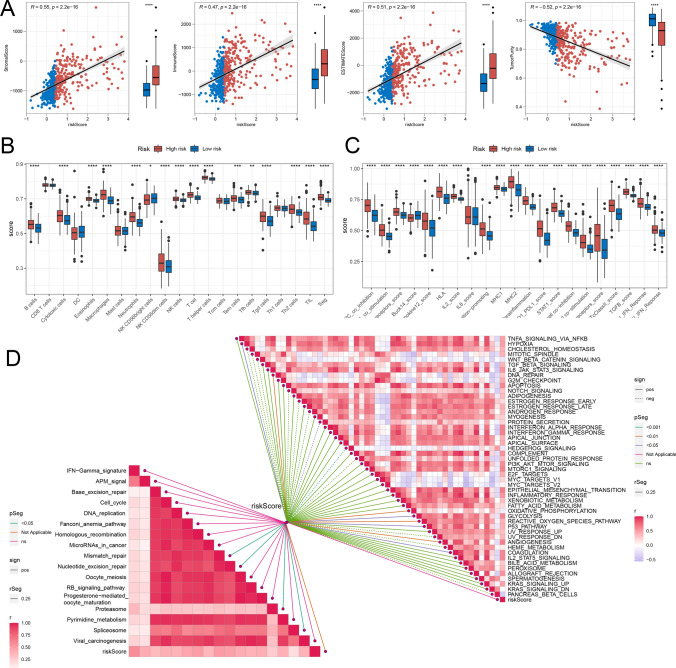
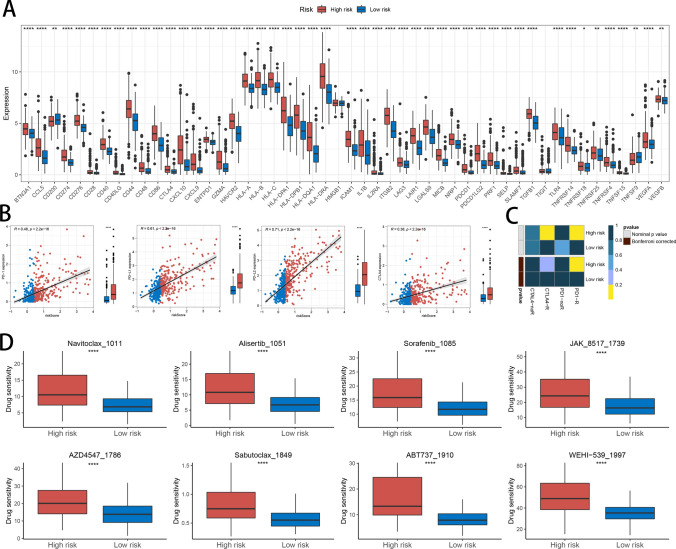
Methods: Expression data from The Cancer Genome Atlas (TCGA) and Chinese Glioma Genome Atlas (CGGA) were analyzed to identify an optimal HDAC-related risk signature from 73 genes using 10 machine learning algorithms. Patients were stratified into high- and low-risk groups based on the median risk score. Prognostic accuracy was evaluated using Kaplan-Meier survival analysis and receiver operating characteristic (ROC) curves. Functional enrichment analyses, including Gene Ontology (GO), Kyoto Encyclopedia of Genes and Genomes (KEGG), and Gene Set Enrichment Analysis (GSEA), were performed to explore pathways linked to the gene signature. Immune infiltration and tumor microenvironment characteristics were assessed using Single Sample Gene Set Enrichment Analysis (ssGSEA) and ESTIMATE algorithm. SubMap was applied to predict responsiveness to immune checkpoint inhibitors, and chemotherapeutic sensitivity was analyzed via the Genomics of Drug Sensitivity in Cancer (GDSC) database.

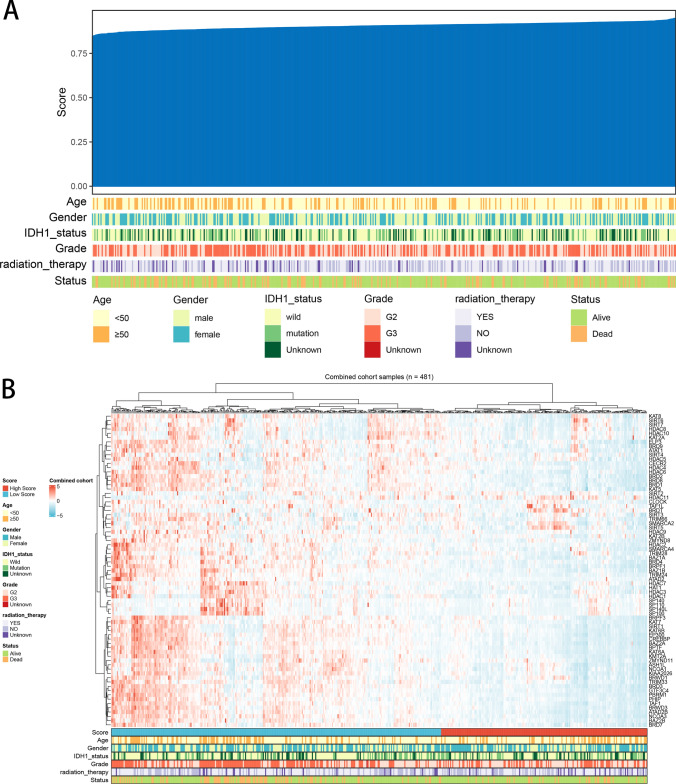
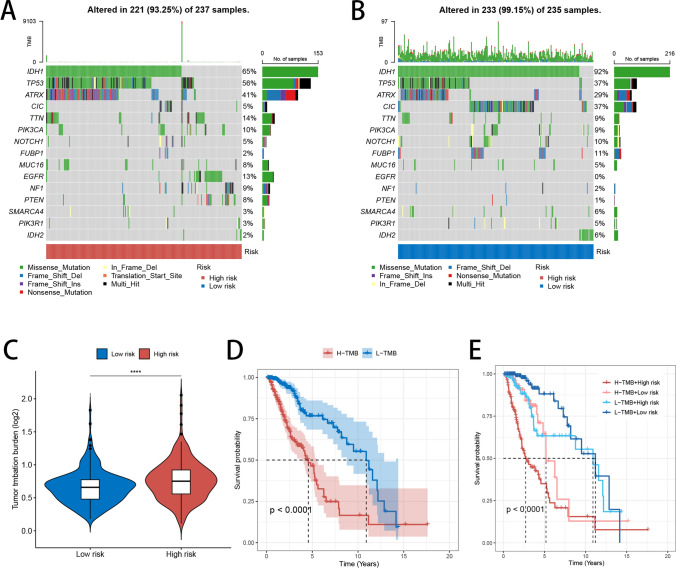
Results: A prognostic model consisting of four HDAC-related genes-SP140, BAZ1B, SP100, and SIRT1-was identified. This signature displayed strong prognostic accuracy, achieving a C-index of 0.945. Individuals with LGG were systematically divided into high-risk and low-risk cohorts based on the median risk value, enabling more precise risk stratification. The survival prognosis was significantly worse in the high-risk cohort compared to the low-risk group, highlighting distinct survival trajectories. Notably, the two cohorts exhibited marked shifts in immune checkpoint gene transcriptional profiles and immune cell infiltration maps, underscoring fundamental biological differences that contribute to these differing prognoses.

Conclusion: We developed an HDAC-related four-gene prognostic model that correlates with survival, immune landscape, and therapeutic response in LGG patients. This model may guide personalized treatment strategies and improve prognostic accuracy, warranting further validation in clinical settings.

Keywords: HDAC; Immunotherapy; Low grade glioma; Prognosis; Tumor microenvironment.


Conflict of interest statement

Declarations. Ethics approval and consent to participate: Not applicable. Consent for publication: Not applicable. Competing interests : The authors declare no competing interests.

Figures

Fig. 1
Fig. 1
Patient Profiles and HDAC-Related Gene Expression Profiles. A Heatmap displaying clinicopathological characteristics and HDAC-related gene scores for each patient. B Heatmap showing the expression levels of the 73 HDAC-related genes
Fig. 2
Fig. 2
Comparative Analysis of HDAC-Related Gene Expression in LGG Tumors and Normal Tissues. A-F Boxplots comparing the expression levels of 73 HDAC-related genes between LGG tumors and normal tissues
Fig. 3
Fig. 3
Construction of the HDAC-Related Risk Signature in LGG Patients. A Testing of 101 combinations of machine learning algorithms for HDAC-related signatures using a tenfold cross-validation framework. B, C Kaplan–Meier survival analysis of OS in LGG patients, stratified by the two identified risk groups. D, E ROC analysis showing the AUC for predicting OS at 1, 3, and 5 years in both the TCGA and CGGA datasets. F, G Kaplan–Meier analysis of PFS and DFS in LGG, stratified by the two risk groups in the TCGA dataset. H Kaplan–Meier survival analysis of OS in LGG, stratified by the expression levels of the four hub genes
Fig. 4
Fig. 4
Association analysis of Clinical Characteristics, Functional Enrichment Analysis, and Risk Scores. A Analysis of risk score differences across subgroups categorized by clinicopathological characteristics. BD GO, KEGG, and GSEA enrichment analyses
Fig. 5
Fig. 5
Gene Mutation Analysis. A, B Waterfall plots showing TMB in high- and low-risk groups, highlighting the 15 most frequently mutated genes. C Violin plot illustrating TMB levels in high- and low-risk groups. D Survival analysis of patients with high and low TMB levels. E Survival analysis of patients based on combined TMB levels and risk scores
Fig. 6
Fig. 6
Genomic Alteration Analysis. A Profiles of overall copy number GISTIC scores in LGG patients. B Comparison of amplification and deletion frequency differences between high- and low-risk groups. C Comparison of the burden of copy number gains and losses between high- and low-risk groups at both focal and arm levels. D, E Display of clinicopathological characteristics alongside mRNAsi and mDNAsi for each patient. F Comparison of mRNAsi and mDNAsi levels between high- and low-risk groups
Fig. 7
Fig. 7
Immune Infiltration and Variations in Biological Pathways. A Comparison of StromalScore, ImmuneScore, ESTIMATEScore, and TumorPurity between the two risk groups. B, C Analysis of infiltrated immune cell levels and immune function differences between the two risk groups. D Correlation study between risk scores and biological pathways
Fig. 8
Fig. 8
The Relationship Between Risk Scores and Responses to Immunotherapy and Chemotherapy. A Comparison of immune checkpoint expression levels between the two risk groups. B Correlation analysis of PD-1, PD-L1, PD-L2, and CTLA4 expression levels with risk scores. C Prediction of immunotherapy responses to anti-PD-1 and anti-CTLA-4 in high- and low-risk patient groups based on SubMap analysis. D Comparison of antitumor drug sensitivity between high- and low-risk groups

References

    1. Ostrom QT, et al. CBTRUS statistical report: primary brain and other central nervous system tumors diagnosed in the United States in 2015–2019. Neuro Oncol. 2022;24(5):v1–95. - PMC - PubMed
    1. Baumert BG, et al. Temozolomide chemotherapy versus radiotherapy in high-risk low-grade glioma (EORTC 22033–26033): a randomised, open-label, phase 3 intergroup study. Lancet Oncol. 2016;17(11):1521–32. - PMC - PubMed
    1. Kiran M, et al. A prognostic signature for lower grade gliomas based on expression of long non-coding RNAs. Mol Neurobiol. 2019;56(7):4786–98. - PMC - PubMed
    1. Bush NA, Chang SM, Berger MS. Current and future strategies for treatment of glioma. Neurosurg Rev. 2017;40(1):1–14. - PubMed
    1. Lombardi G, et al. Clinical management of diffuse low-grade gliomas. Cancers (Basel). 2020. 10.3390/cancers12103008. - PMC - PubMed

LinkOut - more resources