

Within-Hospital Price Gaps Across National Insurers
- PMID: 39714838
- PMCID: PMC11667364
- DOI: 10.1001/jamanetworkopen.2024.51941
Within-Hospital Price Gaps Across National Insurers
Abstract
Importance: Commercial prices for hospital care are high and vary widely in the US. Employers and state policymakers are exploring reference-based pricing (RBP) to set their payment rates as multiples of Medicare prices; understanding the range of commercial price variation within a hospital is important for calculating the appropriate price targets that are effectively low to generate savings but also feasible and viable to local hospital markets.
Objective: To examine within-hospital maximum-to-minimum commercial hospital price gaps negotiated by 5 national insurers and estimate plan savings if the minimum prices within each hospital are used as new payment level.
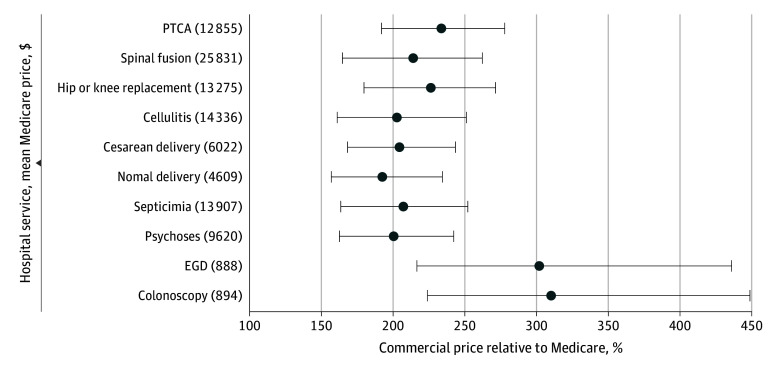
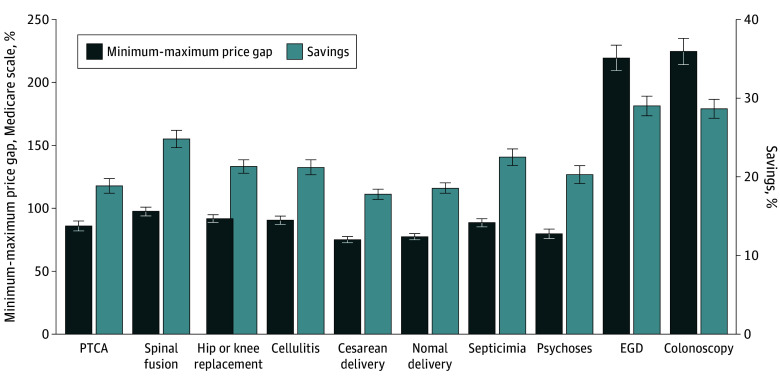
Design, setting, and participants: This cross-sectional study used the insurer-disclosed Transparency in Coverage data as of March 2024. There were 40 382 commercial hospital facility prices extracted for 10 common services negotiated by CVS Health, Elevance Health, Blue Cross Blue Shield, Cigna, and United Healthcare, measured at the hospital-service-insurer level relative to the 2024 Medicare prices. For each hospital-service pair, the minimum, enrollment-weighted mean, and maximum prices were calculated, as well as the maximum-to-minimum price gaps. Plan savings were then estimated using the minimum within-hospital prices as the new payment levels.
Exposure: Insurer price disclosure under federal Transparency in Coverage rule.
Main outcomes and measures: Maximum-to-minimum commercial price gaps and estimated savings if using the minimum prices at hospital-service level.
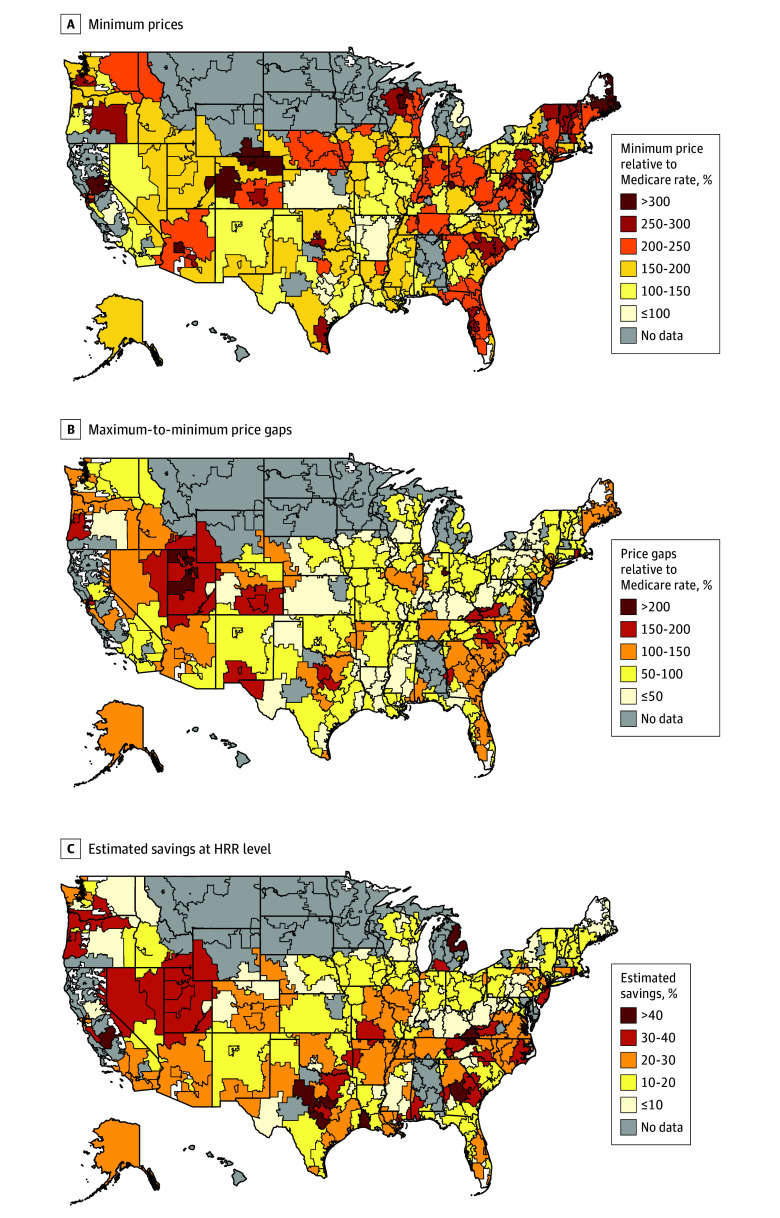
Results: Among 40 382 commercial hospital prices negotiated by 5 national insurers, the national means of minimum prices were 168% (95% CI, 167%-169%) of Medicare rates for inpatient services and 220% (95% CI, 215%-226%) of Medicare rates for outpatient services. National mean minimum-to-maximum price gaps were 86% (95% CI, 85%-87%) and 222% (95% CI, 215%-229%) of Medicare rates for inpatient and outpatient services, respectively. If using the minimum within-hospital prices, compared with current prices, payers could save 21% (95% CI, 20%-21%) for inpatient services and 29% (95% CI, 28%-30%) for outpatient services.
Conclusions and relevance: In this cross-sectional study, commercial prices across different national insurers varied substantially for the same hospital and service. These results suggest that employers and policymakers interested in RBP benchmarking may use the lowest prices among major insurers in their local hospital market as references to negotiate lower prices.
Conflict of interest statement
Figures
Similar articles
-
Potential Factors Associated With Commercial-to-Medicare Relative Prices at the Substate Level.JAMA Health Forum. 2025 Jul 3;6(7):e251640. doi: 10.1001/jamahealthforum.2025.1640. JAMA Health Forum. 2025. PMID: 40608307 Free PMC article.
-
Commercial insurers' market power and hospital prices in Medicaid managed care.Health Serv Res. 2025 Feb;60(1):e14407. doi: 10.1111/1475-6773.14407. Epub 2024 Nov 9. Health Serv Res. 2025. PMID: 39520269
-
Low-Volume Elective Surgery and Outcomes in Medicare Beneficiaries Treated at Hospital Networks.JAMA Surg. 2024 Feb 1;159(2):203-210. doi: 10.1001/jamasurg.2023.6542. JAMA Surg. 2024. PMID: 38150228 Free PMC article.
-
Payment methods for outpatient care facilities.Cochrane Database Syst Rev. 2017 Mar 3;3(3):CD011153. doi: 10.1002/14651858.CD011153.pub2. Cochrane Database Syst Rev. 2017. PMID: 28253540 Free PMC article.
-
Signs and symptoms to determine if a patient presenting in primary care or hospital outpatient settings has COVID-19.Cochrane Database Syst Rev. 2022 May 20;5(5):CD013665. doi: 10.1002/14651858.CD013665.pub3. Cochrane Database Syst Rev. 2022. PMID: 35593186 Free PMC article.
Cited by
-
Commercial price variation for common imaging studies.Health Aff Sch. 2025 Apr 30;3(5):qxaf092. doi: 10.1093/haschl/qxaf092. eCollection 2025 May. Health Aff Sch. 2025. PMID: 40406496 Free PMC article.
-
Commercial Price Variation for Common Services in General Surgery.JAMA Netw Open. 2025 Jun 2;8(6):e2517818. doi: 10.1001/jamanetworkopen.2025.17818. JAMA Netw Open. 2025. PMID: 40560589 Free PMC article.
References
-
- Perry MJ. Chart of the Day…. or Century? American Enterprise Institute . July 23, 2022. Accessed June 4, 2024. https://www.aei.org/carpe-diem/chart-of-the-day-or-century-8/
-
- Rakotoniaina A. Overview of States’ Hospital Reference-Based Pricing to Medicare Initiatives. National Academy for State Health Policy . February 7, 2023. Accessed July 18, 2024. https://nashp.org/state-tracker/overview-of-states-hospital-reference-ba...
Publication types
MeSH terms
LinkOut - more resources
Full Text Sources
Medical
