. 2025 Apr 1;6(4):606-615.
doi: 10.34067/KID.0000000688. Epub 2024 Dec 23.

Podocyte Injury and Long-Term Kidney Prognosis in Patients with Lupus Nephritis

Affiliations

Podocyte Injury and Long-Term Kidney Prognosis in Patients with Lupus Nephritis

Masahiro Okabe et al. Kidney360. .

Abstract

Key Points:

  1. Podocyte injury, as indicated by early growth response 1 expression, was correlated with the clinical and histopathological activities of lupus nephritis (LN).

  2. Podocyte injury was associated with poor long-term kidney prognosis in patients with active LN.

  3. To improve the prognosis of patients with LN, treatment strategies on the basis of the degree of podocyte injury may be considered.

Background: Lupus nephritis (LN) is a major complication of SLE. Like other types of GN, podocyte injury has been observed in patients with LN. However, the association between podocyte injury and kidney prognosis in patients with LN has not been well elucidated. The aim of this study was to explore the association between podocyte injury and clinical and histological status and kidney prognosis in patients with LN.

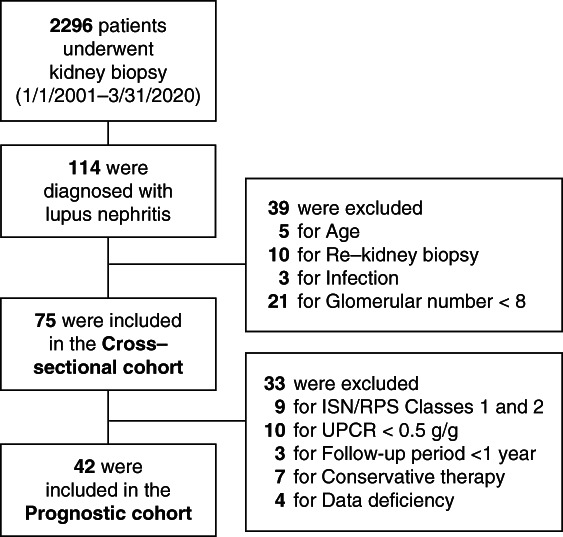
Methods: Seventy-five patients histopathologically diagnosed with LN were enrolled in this study. Early growth response 1 (EGR1) expression in podocytes, representing podocyte injury, was detected through immunohistochemistry. The correlation between the proportion of glomeruli with podocytes expressing EGR1 (%EGR1glo) and the clinical and histological features of LN were evaluated. Subsequently, the association between %EGR1glo and kidney prognosis was examined in a group of patients with LN class 3, 4, or 5 who showed ≥0.5 g/g of urinary protein–creatinine ratio and received immunosuppressive therapy. Hazard ratio was calculated using univariate Cox proportional hazards regression.

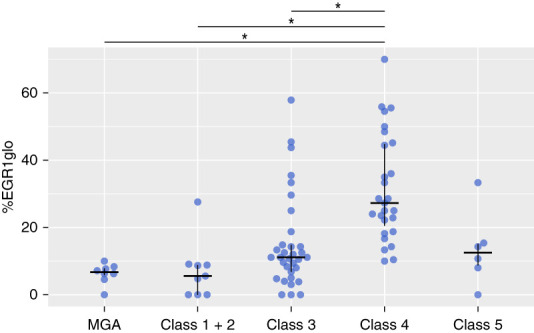
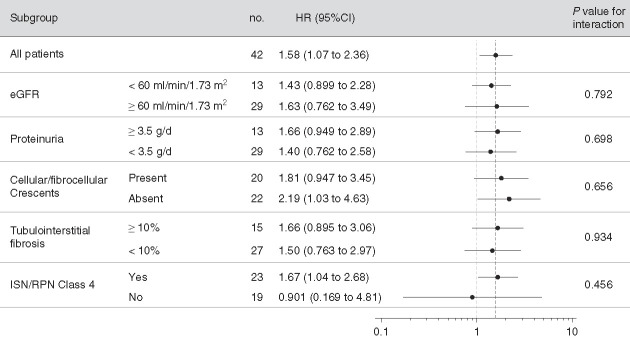
Results: %EGR1glo was highest in patients with LN class 4, significantly correlated with the SLE Disease Activity Index score, urinary protein level, and prevalence of glomeruli showing cellular/fibrocellular crescents, endocapillary hypercellularity, and fibrinoid necrosis and inversely correlated with eGFR. Higher %EGR1glo was significantly associated with sustained ≥30% eGFR decline over 10 years in patients with LN class 3, 4, or 5 (n=42; hazard ratio, 1.58 [95% confidence interval, 1.07 to 2.36] per 10% increase in %EGR1glo). There was no significant interaction between patients grouped by kidney function, urinary protein level, presence of cellular/fibrocellular crescents, degree of tubulointerstitial fibrosis, and LN classification.

Conclusions: Podocyte damage, as indicated by EGR1 expression, was associated with poor long-term kidney prognosis in patients with active LN. Treatment strategies on the basis of the extent of podocyte injury may be necessary.

Keywords: SLE; lupus nephritis; podocyte.


Conflict of interest statement

Disclosure forms, as provided by each author, are available with the online version of the article at http://links.lww.com/KN9/A838.

Figures

None
Graphical abstract
Figure 1
Figure 1
Flow chart of patient enrollment. ISN/RPS, International Society of Nephrology/Renal Pathology Society; UPCR, urinary protein–creatinine ratio.
Figure 2
Figure 2
%EGR1glo among pathological classes of LN. %EGR1glo was significantly different among the groups (P < 0.001). Post hoc analyses showed that compared with non-SLE patients with MGA (n=8), patients with LN class 4 had a significantly higher %EGR1glo (27.3 [20.5–44.8]% versus 6.7 [5.8–7.9]%, adjusted P < 0.001). The median %EGR1glo in patients with LN class 3 (11.1 [6.8–14.8] %) or class 5 (12.5 [8.7–15.1]%) was higher than that in non-SLE patients with MGA, with no statistically significant difference (adjusted P = 0.172 and adjusted P = 0.280, respectively). Among LN classes, patients with LN class 4 showed a higher %EGR1glo than patients with LN classes 1+2 (5.6 [0.0–8.8]%) and 3 (each adjusted P < 0.001) and tended to be higher than patients with LN class 5 (adjusted P = 0.076). No statistically significant differences were found between the patients in the other group pairs. ISN/RPS LN classes 1 and 2 were categorized as LN class 1+2, ISN/RPS LN classes 3 and 3+5 as LN class 3, and ISN/RPS LN classes 4 and 4+5 as LN class 4. The difference in %EGR1glo was evaluated using the Kruskal–Wallis test and post hoc analysis was performed using the Bonferroni–Holm method. Horizontal bars show the median, and vertical bars indicate the 25–75 percentiles. *Adjusted P < 0.001. LN, lupus nephritis; MGA, minor glomerular abnormalities; %EGR1glo, proportion of glomeruli with podocytes expressing EGR1.
Figure 3
Figure 3
Kaplan–Meier curves. Patients in the prognostic cohort were equally divided into three groups according to %EGR1glo values. The unadjusted survival curves depict time to the first achievement of <0.5 g/g of UPCR over 1 year (A) and time free of ≥30% decline in eGFR from baseline over 10 years (B). P values were calculated using the log-rank trend test. The median follow-up period did not differ significantly: 8.2 (6.9–10) years in the low %EGR1glo group, 10 (6.1–10) years in the intermediate %EGR1glo group, and 8.5 (6.6–10) years in the high %EGR1glo group (Kruskal–Wallis test, P = 0.899).
Figure 4
Figure 4
Subgroup analysis for kidney prognosis. HRs per 10% increase in %EGR1glo for the time to ≥30% eGFR decline from baseline over 10 years were analyzed using univariate Cox proportional hazards regression in subgroups according to eGFR, urinary protein level, presence of cellular/fibrocellular crescents, percentage of tubulointerstitial fibrosis, and ISN/RPS LN classification. Points and bars represent HRs and 95% CIs. N represents the number of patients. CI, confidence interval; HR, hazard ratio.

Similar articles

References

    1. Almaani S, Meara A, Rovin BH. Update on lupus nephritis. Clin J Am Soc Nephrol. 2017;12(5):825–835. doi:10.2215/CJN.05780616 - DOI - PMC - PubMed
    1. Hanly JG O’Keeffe AG Su L, et al. . The frequency and outcome of lupus nephritis: results from an international inception cohort study. Rheumatology. 2016;55(2):252–262. doi:10.1093/rheumatology/kev311 - DOI - PMC - PubMed
    1. Pagtalunan ME Miller PL Jumping-Eagle S, et al. . Podocyte loss and progressive glomerular injury in type II diabetes. J Clin Invest. 1997;99(2):342–348. doi:10.1172/JCI119163 - DOI - PMC - PubMed
    1. Wharram BL Goyal M Wiggins JE, et al. . Podocyte depletion causes glomerulosclerosis: diphtheria toxin-induced podocyte depletion in rats expressing human diphtheria toxin receptor transgene. J Am Soc Nephrol. 2005;16(10):2941–2952. doi:10.1681/ASN.2005010055 - DOI - PubMed
    1. Wiggins RC. The spectrum of podocytopathies: a unifying view of glomerular diseases. Kidney Int. 2007;71(12):1205–1214. doi:10.1038/sj.ki.5002222 - DOI - PubMed