

DC algorithm for estimation of sparse Gaussian graphical models
- PMID: 39715197
- PMCID: PMC11666004
- DOI: 10.1371/journal.pone.0315740
DC algorithm for estimation of sparse Gaussian graphical models
Abstract
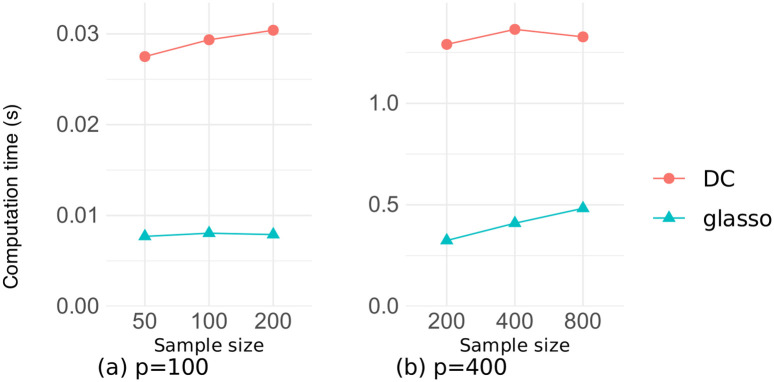
Sparse estimation of a Gaussian graphical model (GGM) is an important technique for making relationships between observed variables more interpretable. Various methods have been proposed for sparse GGM estimation, including the graphical lasso that uses the ℓ1 norm regularization term, and other methods that use nonconvex regularization terms. Most of these methods approximate the ℓ0 (pseudo) norm by more tractable functions; however, to estimate more accurate solutions, it is preferable to directly use the ℓ0 norm for counting the number of nonzero elements. To this end, we focus on sparse estimation of GGM with the cardinality constraint based on the ℓ0 norm. Specifically, we convert the cardinality constraint into an equivalent constraint based on the largest-K norm, and reformulate the resultant constrained optimization problem into an unconstrained penalty form with a DC (difference of convex functions) representation. To solve this problem efficiently, we design a DC algorithm in which the graphical lasso algorithm is repeatedly executed to solve convex optimization subproblems. Experimental results using two synthetic datasets show that our method achieves results that are comparable to or better than conventional methods for sparse GGM estimation. Our method is particularly advantageous for selecting true edges when cross-validation is used to determine the number of edges. Moreover, our DC algorithm converges within a practical time frame compared to the graphical lasso.
Copyright: © 2024 Shiratori, Takano. This is an open access article distributed under the terms of the Creative Commons Attribution License, which permits unrestricted use, distribution, and reproduction in any medium, provided the original author and source are credited.
Conflict of interest statement
The authors have declared that no competing interests exist.
Figures


Similar articles
-
Cardinality Constrained Portfolio Optimization via Alternating Direction Method of Multipliers.IEEE Trans Neural Netw Learn Syst. 2024 Feb;35(2):2901-2909. doi: 10.1109/TNNLS.2022.3192065. Epub 2024 Feb 5. IEEE Trans Neural Netw Learn Syst. 2024. PMID: 35895648
-
Efficient ℓ0 -norm feature selection based on augmented and penalized minimization.Stat Med. 2018 Feb 10;37(3):473-486. doi: 10.1002/sim.7526. Epub 2017 Oct 30. Stat Med. 2018. PMID: 29082539 Free PMC article.
-
Robust Gaussian graphical modeling via l1 penalization.Biometrics. 2012 Dec;68(4):1197-206. doi: 10.1111/j.1541-0420.2012.01785.x. Epub 2012 Sep 28. Biometrics. 2012. PMID: 23020775 Free PMC article.
-
Pathway Graphical Lasso.Proc AAAI Conf Artif Intell. 2015 Jan;2015:2617-2623. Proc AAAI Conf Artif Intell. 2015. PMID: 26167394 Free PMC article.
-
Convex compressive beamforming with nonconvex sparse regularization.J Acoust Soc Am. 2021 Feb;149(2):1125. doi: 10.1121/10.0003373. J Acoust Soc Am. 2021. PMID: 33639805
References
-
- Ortiz A, Munilla J, Álvarez-Illán I, Górriz JM, Ramírez J, Alzheimer’s Disease Neuroimaging Initiative. Exploratory graphical models of functional and structural connectivity patterns for Alzheimer’s Disease diagnosis. Frontiers in Computational Neuroscience. 2015;9:132. doi: 10.3389/fncom.2015.00132 - DOI - PMC - PubMed
-
- Idé T, Lozano AC, Abe N, Liu Y. Proximity-based anomaly detection using sparse structure learning. In: Proceedings of the 2009 SIAM International Conference on Data Mining; 2009. p. 97–108.
-
- Tan C, Lee L, Tang J, Jiang L, Zhou M, Li P. User-level sentiment analysis incorporating social networks. In: Proceedings of the 17th ACM SIGKDD International Conference on Knowledge Discovery and Data Mining; 2011. p. 1397–1405.
-
- Fan J, Liao Y, Liu H. An overview of the estimation of large covariance and precision matrices. The Econometrics Journal. 2016;19(1):C1–C32. doi: 10.1016/j.jeconom.2018.04.002 - DOI
-
- Drton M, Maathuis MH. Structure learning in graphical modeling. Annual Review of Statistics and Its Application. 2017;4(1):365–393. doi: 10.1146/annurev-statistics-060116-053803 - DOI
MeSH terms
LinkOut - more resources
Full Text Sources
