

Development of a sequential laser microdissection tissue cuts workflow for the spatial and quantitative analysis of drugs in fresh frozen tissue sections
- PMID: 39715213
- PMCID: PMC11665993
- DOI: 10.1371/journal.pone.0312542
Development of a sequential laser microdissection tissue cuts workflow for the spatial and quantitative analysis of drugs in fresh frozen tissue sections
Abstract
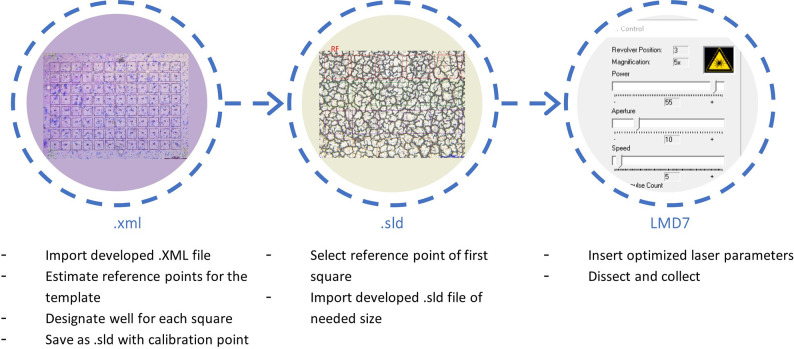
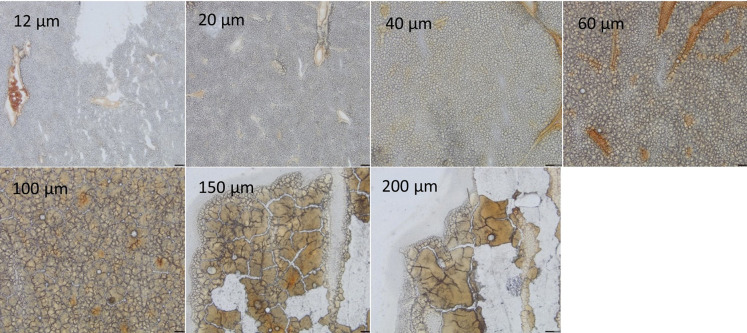
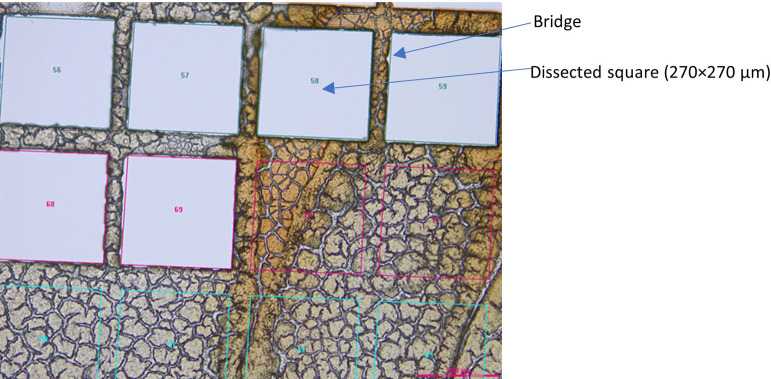
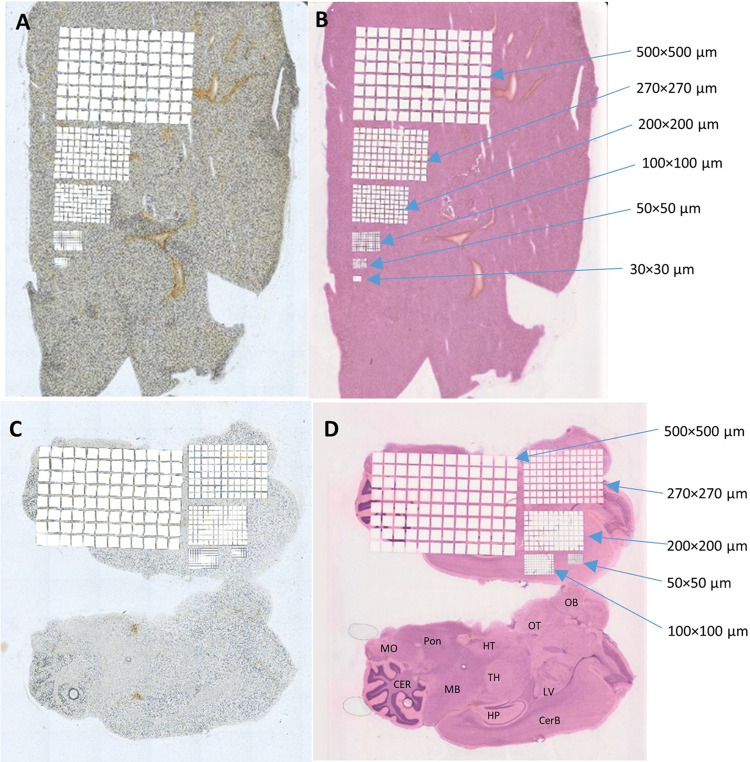
Mass spectrometry imaging (MSI) is a well-established technique that allows to determine the distribution of small molecules, such as lipids, metabolites, and drugs, as well as large molecules in tissue sections. Because of the tissue heterogeneity, resulting in different matrix effects, and to the fact that the measured compounds are not entirely "extracted" from the tissue during the measurement, the absolute quantitative aspect of MSI is limited. To combine compound quantification with spatial information on fresh frozen unstained tissue sections, laser (capture) microdissection has been used to isolate tissue sections for compound extraction and LC-MS/MS quantification. Although this method relying on manual ROIs selection is rather sensitive compared to traditional MSI methods, it lacks the throughput needed to screen entire tissue sections. To apply a higher throughput tissue screening approach, we propose herein a workflow for performing indiscriminate and sequential LMD tissue section cuts that can cover up to 96 cuts collected in a 96 well plate on Leica LMD systems, for further extractions and LC-MS/MS analysis. Our workflow relies on the creation and implementation of 96 squares microgrid templates for the LMD cut of different area sizes (30x30 μm2, 50x50 μm2, 100x100 μm2, 200x200 μm2, 270x270 μm2 and 500x500 μm2) using 5 different magnifications (5x, 10x, 20x, 40x and 63x), on fresh frozen tissue sections. The method was applied on 20μm mouse brain and liver tissue sections. The tissue cut collection yields were evaluated visually and by the detection of the sprayed standards on the tissue sections, and found to be ranging from 78% to 91%, and the throughput of the LMD cuts and collection in a 96 well format, was measured to be from 19 to 37 minutes per tissue section, depending on the 96 squares microgrid template and the corresponding magnification lens used. Further extraction and LC-MS/MS analysis of 3 different compounds previously sprayed on a mouse liver tissue section allowed to determine the LLOQ the workflow allows to achieve when using the different templates.
Copyright: © 2024 Maris et al. This is an open access article distributed under the terms of the Creative Commons Attribution License, which permits unrestricted use, distribution, and reproduction in any medium, provided the original author and source are credited.
Conflict of interest statement
The authors have declared that no competing interests exist.
Figures
References
-
- Monro A M. Are routine tissue distribution studies justifiable for approval of human drugs? Drug Metabolism & Disposition. 1994; 22: 341–342. . - PubMed
-
- Jiang H, Zeng J, Zheng N, Kandoussi H, Peng Q, Valentine J L, et al.. A convenient strategy for quantitative determination of drug concentrations in tissue homogenates using a liquid chromatography/tandem mass spectrometry assay for plasma samples. Analytical Chemistry. 2011; 83(16): 6237–6244. doi: 10.1021/ac200820q - DOI - PubMed
MeSH terms
Substances
LinkOut - more resources
Full Text Sources
