. 2024 Dec;48(12):e70025.
doi: 10.1111/cogs.70025.

A Linguistic-Sensorimotor Model of the Basic-Level Advantage in Category Verification

Affiliations

A Linguistic-Sensorimotor Model of the Basic-Level Advantage in Category Verification

Cai Wingfield et al. Cogn Sci. 2024 Dec.

Abstract

People are generally more accurate at categorizing objects at the basic level (e.g., dog) than at more general, superordinate categories (e.g., animal). Recent research has suggested that this basic-level advantage emerges from the linguistic-distributional and sensorimotor relationship between a category concept and object concept, but the proposed mechanisms have not been subject to a formal computational test. In this paper, we present a computational model of category verification that allows linguistic distributional information and sensorimotor experience to interact in a grounded implementation of a full-size adult conceptual system. In simulations across multiple datasets, we demonstrate that the model performs the task of category verification at a level comparable to human participants, and-critically-that its operation naturally gives rise to the basic-level-advantage phenomenon. That is, concepts are easier to categorize when there is a high degree of overlap in sensorimotor experience and/or linguistic distributional knowledge between category and member concepts, and the basic-level advantage emerges as an overall behavioral artifact of this linguistic and sensorimotor overlap. Findings support the linguistic-sensorimotor preparation account of the basic-level advantage and, more broadly, linguistic-sensorimotor theories of the conceptual system.

Keywords: Basic level; Categories; Concepts; Linguistic distributional; Sensorimotor.


Conflict of interest statement

We have no conflicts of interest to disclose.

Figures

Fig. 1
Fig. 1
Schematic representation of the computational model; items and distances are illustrative only. The linguistic component of the model comprises the linguistic graph (A) across which activation spreads (bottom panels), together with a set of currently activated items (B); as the set fills, it attenuates further activation within the graph. The sensorimotor component of the model comprises the sensorimotor space (C) through which activation spreads (top panels), together with a set of currently activated items (D); as this set fills, it attenuates further activation within the space. The linguistic and sensorimotor components interact via item‐level mappings (E). Items sufficiently activated in either component enter a shared working‐memory buffer (F).
Fig. 2
Fig. 2
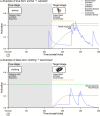
Examples of target object activations over time in the sensorimotor (red line) and linguistic (blue line) components during the modeling of an individual trial. The dotted green line shows a sample decision threshold: if activation in either component crosses the threshold, then a “yes” decision is made (Panel A), otherwise a “no” decision results (Panel B).
Fig. 3
Fig. 3
ROC curves of Simulation 1 category verification performance of model versus human participants for all items (Panel A), basic‐level items (Panel B), and superordinate‐level items (Panel C). Model ROC curve (solid blue line) is plotted across decision thresholds 0.0–1.0 compared to chance performance of a random classifier (dotted red line). Performance of each individual participant is indicated by a cross, with the area under the curve (AUC) shown as a shaded background region. Inset numbers per panel report AUC for the model and the range of AUC values for human participants.
Fig. 4
Fig. 4
Scatterplot of peak activation level attained by each object concept within the model against the proportion of human participants who responded “yes” (i.e., accepted that object as a category member) in each Simulation 1 dataset. Marginal plots depict distribution densities. R‐values relate to linear trendlines per dataset.
Fig. 5
Fig. 5
ROC curves of Simulation 2 category verification performance of model versus human participants for all items (Panel A), basic‐level items (Panel B), and superordinate‐level items (Panel C). Model ROC curve (solid blue line) is plotted across decision thresholds 0.0–1.0 compared to chance performance of a random classifier (dotted red line). Performance of each individual participant is indicated by a cross, with the area under the curve (AUC) shown as a shaded background region. Inset numbers per panel report AUC for the model and the range of AUC values for human participants.
Fig. 6
Fig. 6
Scatterplot of peak activation level attained by each object concept within the model against the proportion of human participants who responded “yes” in Simulation 2 (i.e., accepted that object as a category member in a go/no‐go design). Marginal plots depict distribution densities. R‐value relates to linear trendline.
Fig. A1
Fig. A1
ROC curves for the original unaltered, sensorimotor‐only and linguistic‐only models. Left‐column panels (A, C, E) show results from Simulation 1's item set; right‐column panels (B, D, F) show results from Simulation 2's item set. First‐row panels (A, B) show results for all items; middle‐row panels (C, D) show results for basic‐level items only; bottom‐row panels (E, F) show results for superordinate‐level items only. ROC curves are plotted across decision thresholds 0.0–1.0 compared to chance performance of a random classifier (dotted red line).

Similar articles

Cited by

References

    1. Anwyl‐Irvine, A. L. , Massonnié, J. , Flitton, A. , Kirkham, N. , & Evershed, J. K. (2020). Gorilla in our midst: An online behavioral experiment builder. Behavior Research Methods, 52(1), 388–407. 10.3758/s13428-019-01237-x - DOI - PMC - PubMed
    1. Baddeley, A. (2000). The episodic buffer: A new component of working memory?. Trends in cognitive sciences, 4(11), 417–423. 10.1016/S1364-6613(00)01538-2 - DOI - PubMed
    1. Barsalou, L. W. (1999). Perceptual symbol systems. Behavioral and Brain Sciences, 22(4), 577–660. 10.1017/S0140525x99002149 - DOI - PubMed
    1. Barsalou, L. W. , Niedenthal, P. M. , Barbey, A. , & Ruppert, J. (2003). Social embodiment. In Ross B. (Ed.), The psychology of learning and motivation (Vol. 43, pp. 43–92). Academic Press.
    1. Barsalou, L. W. , Santos, A. , Simmons, W. K. , & Wilson, C. D. (2008). Language and simulation in conceptual processing. In De Vega M., Glenberg A. M., & Graesser A. C. (Eds.), Symbols and embodiment: Debates on meaning and cognition (pp. 245–283). Oxford University Press.

LinkOut - more resources