Comparative Study
. 2024 Dec 23;20(12):e1012039.
doi: 10.1371/journal.pcbi.1012039. eCollection 2024 Dec.

Evaluation and comparison of methods for neuronal parameter optimization using the Neuroptimus software framework

Affiliations
Comparative Study

Evaluation and comparison of methods for neuronal parameter optimization using the Neuroptimus software framework

Máté Mohácsi et al. PLoS Comput Biol. .

Abstract

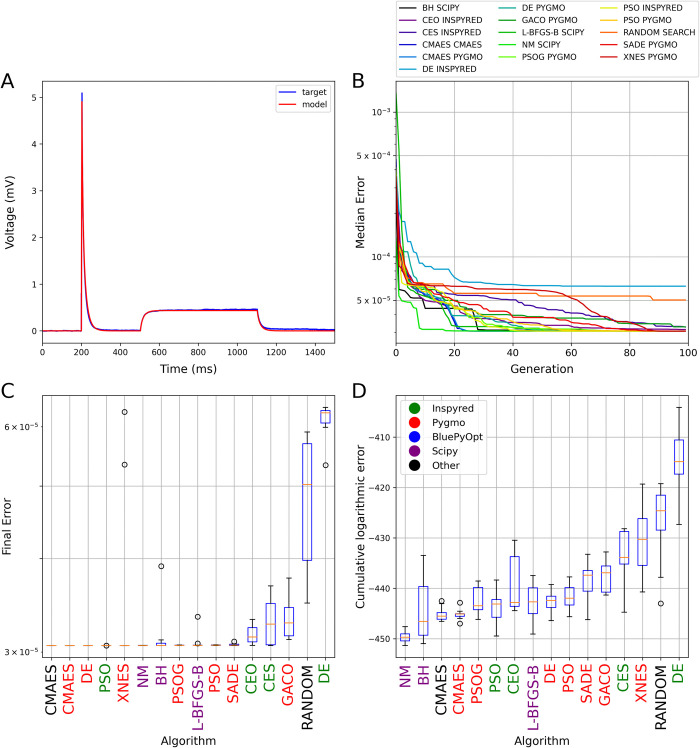
Finding optimal parameters for detailed neuronal models is a ubiquitous challenge in neuroscientific research. In recent years, manual model tuning has been gradually replaced by automated parameter search using a variety of different tools and methods. However, using most of these software tools and choosing the most appropriate algorithm for a given optimization task require substantial technical expertise, which prevents the majority of researchers from using these methods effectively. To address these issues, we developed a generic platform (called Neuroptimus) that allows users to set up neural parameter optimization tasks via a graphical interface, and to solve these tasks using a wide selection of state-of-the-art parameter search methods implemented by five different Python packages. Neuroptimus also offers several features to support more advanced usage, including the ability to run most algorithms in parallel, which allows it to take advantage of high-performance computing architectures. We used the common interface provided by Neuroptimus to conduct a detailed comparison of more than twenty different algorithms (and implementations) on six distinct benchmarks that represent typical scenarios in neuronal parameter search. We quantified the performance of the algorithms in terms of the best solutions found and in terms of convergence speed. We identified several algorithms, including covariance matrix adaptation evolution strategy and particle swarm optimization, that consistently, without any fine-tuning, found good solutions in all of our use cases. By contrast, some other algorithms including all local search methods provided good solutions only for the simplest use cases, and failed completely on more complex problems. We also demonstrate the versatility of Neuroptimus by applying it to an additional use case that involves tuning the parameters of a subcellular model of biochemical pathways. Finally, we created an online database that allows uploading, querying and analyzing the results of optimization runs performed by Neuroptimus, which enables all researchers to update and extend the current benchmarking study. The tools and analysis we provide should aid members of the neuroscience community to apply parameter search methods more effectively in their research.


Conflict of interest statement

The authors declare that no competing interests exist.

Figures

Fig 1
Fig 1. The results of fitting conductance densities in the Hodgkin-Huxley model.
(A) Example of a comparison plot showing the voltage trace generated by the model with its original parameters (blue) and the trace given by the model using the best parameter set found by the Random Search algorithm (red). (B) Plot showing the evolution of the cumulative minimum error during the optimization. The curves show the median of 10 independent runs for each relevant algorithm. Each generation corresponds to 100 model evaluations. The colors corresponding to the different algorithms (and packages) are shown in the legend. (C) Box plot representing the distribution of the final error scores over 10 independent runs of each algorithm. (D) Box plot representing the convergence speed of the algorithms tested, measured as the area under the logarithmic cumulative minimum error curve (as shown in panel B). In (C) and (D), horizontal red lines indicate the median, the boxes represent the interquartile range, whiskers show the full range (excluding outliers), and circles represent outliers. Boxes representing single-objective algorithms are colored blue and those of multi-objective ones are red. Results are sorted by the median score, from the best to the worst. The names of the packages on the horizontal axis are colored to indicate the implementing package according to the legend in (D).
Fig 2
Fig 2. The results of fitting the parameters of a synaptic connection based on simulated voltage-clamp recordings.
The plots in all four panels are analogous to those in Fig 1. Panel A shows the results of a best-fitting model found by the Random Search algorithm. Note that the error function had only a single component in this use case, and therefore only single-objective optimization algorithms were compared.
Fig 3
Fig 3. The results of fitting the passive biophysical parameters of a morphologically detailed multi-compartmental model to experimental recordings from a hippocampal pyramidal neuron.
The plots in all four panels are analogous to those in Fig 1. Only single-objective methods were tested in this use case because only a single error function (mean squared difference) was used to compare model outputs to the target data. Panel A shows the results of a best-fitting model found by the CMAES algorithm.
Fig 4
Fig 4. The results of fitting the densities of somatic voltage-gated conductances in a morphologically simplified six-compartment model using a simulated voltage trace from a detailed compartmental model as the target.
The plots in all four panels are analogous to those in Fig 1. Panel A shows the results of a best-fitting model found by the CMAES algorithm.
Fig 5
Fig 5. The results of fitting a phenomenological spiking neuronal model (the adaptive exponential integrate-and-fire model) to capture experimental recordings with multiple traces.
The plots in all four panels are analogous to those in Fig 1. Panel A shows the results of a best-fitting model found by the CMAES algorithm. Note that the height of action potentials is irrelevant in the integrate-and-fire model, and the spikes generated by the model are not explicitly represented in the figure.
Fig 6
Fig 6. The results of fitting conductance densities and kinetic parameters in a detailed CA1 pyramidal cell model.
The plots in all four panels are analogous to those in Fig 1. Panel A shows the results of a best-fitting model found by the CMAES algorithm. No target trace is shown because, in this use case, the actual target is defined by the statistics of electrophysiological features that are extracted from a set of experimental recordings.
Fig 7
Fig 7. Overall rankings of optimization algorithms.
Statistics of the ranks achieved by individual optimization algorithms on the different benchmarks involving multiple error components (Figs 1, 4, 5 and 6) according to the final error (A) and convergence speed (B). Brown dots represent the ranks achieved by the algorithms in each use case; boxes indicate the full range and the orange line represents the median of these ranks. The single-objective algorithms are shown in blue and the multi-objective ones in red boxes. The color of the name of the algorithm indicates the implementing package, with the color code included in the legend. Algorithms are sorted according to the median of their ranks.
Fig 8
Fig 8. The results of fitting input fluxes and initial concentrations of key molecular species in a subcellular biochemical network model.
(A) Schematic illustration of the intracellular signaling pathways included in the model (adapted from [45]). (B) Results of 10 model fittings to experimental data using the CES (Inspyred), PSO (Inspyred), and CMAES (Cmaes) algorithms. (C) Plot showing the evolution of the cumulative minimum error during the optimization. (D) Box plot representing the distribution of the final error scores over 10 independent runs of each algorithm. (E) Box plot representing the distribution of the optimized parameters over 10 independent runs of each algorithm. A detailed description of the parameters can be found in the corresponding use case description in the Methods section.

Similar articles

References

    1. Herz AVM, Gollisch T, Machens CK, Jaeger D. Modeling Single-Neuron Dynamics and Computations: A Balance of Detail and Abstraction. Science. 2006. Oct 6;314(5796):80–5. doi: 10.1126/science.1127240 - DOI - PubMed
    1. Einevoll GT, Destexhe A, Diesmann M, Grün S, Jirsa V, de Kamps M, et al.. The Scientific Case for Brain Simulations. Neuron. 2019. May;102(4):735–44. doi: 10.1016/j.neuron.2019.03.027 - DOI - PubMed
    1. Ramaswamy S. Data-driven multiscale computational models of cortical and subcortical regions. Current Opinion in Neurobiology. 2024. Apr;85:102842. doi: 10.1016/j.conb.2024.102842 - DOI - PubMed
    1. Hay E, Hill S, Schürmann F, Markram H, Segev I. Models of Neocortical Layer 5b Pyramidal Cells Capturing a Wide Range of Dendritic and Perisomatic Active Properties. PLoS Computational Biology. 2011. Jul 28;7(7):e1002107. doi: 10.1371/journal.pcbi.1002107 - DOI - PMC - PubMed
    1. Markram H, Muller E, Ramaswamy S, Reimann MW, Abdellah M, Sanchez CA, et al.. Reconstruction and Simulation of Neocortical Microcircuitry. Cell. 2015. Oct;163(2):456–92. doi: 10.1016/j.cell.2015.09.029 - DOI - PubMed

Publication types

LinkOut - more resources