. 2024 Dec 23;15(1):10719.
doi: 10.1038/s41467-024-55559-2.

Preventing excessive autophagy protects from the pathology of mtDNA mutations in Drosophila melanogaster

Affiliations

Preventing excessive autophagy protects from the pathology of mtDNA mutations in Drosophila melanogaster

Najla El Fissi et al. Nat Commun. .

Abstract

Aberration of mitochondrial function is a shared feature of many human pathologies, characterised by changes in metabolic flux, cellular energetics, morphology, composition, and dynamics of the mitochondrial network. While some of these changes serve as compensatory mechanisms to maintain cellular homeostasis, their chronic activation can permanently affect cellular metabolism and signalling, ultimately impairing cell function. Here, we use a Drosophila melanogaster model expressing a proofreading-deficient mtDNA polymerase (POLγexo-) in a genetic screen to find genes that mitigate the harmful accumulation of mtDNA mutations. We identify critical pathways associated with nutrient sensing, insulin signalling, mitochondrial protein import, and autophagy that can rescue the lethal phenotype of the POLγexo- flies. Rescued flies, hemizygous for dilp1, atg2, tim14 or melted, normalise their autophagic flux and proteasome function and adapt their metabolism. Mutation frequencies remain high with the exception of melted-rescued flies, suggesting that melted may act early in development. Treating POLγexo- larvae with the autophagy activator rapamycin aggravates their lethal phenotype, highlighting that excessive autophagy can significantly contribute to the pathophysiology of mitochondrial diseases. Moreover, we show that the nucleation process of autophagy is a critical target for intervention.


Conflict of interest statement

Competing interests: The authors declare no competing interests.

Figures
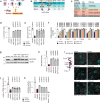
Fig. 1
Fig. 1. A genetic deficiency screen in mtDNA mutator flies.
a Cartoon depicting the genetic screen strategy. Male heterozygous POLγexo- ( + /mut) flies are crossed to a library of heterozygous deficiency strains (Dfs). Resulting double heterozygous (+/POLγexo-; +/Dfs) females are then selected for crosses with fresh heterozygous POLγexo- ( + /mut) males to screen for viable homozygous POLγexo- (mut/mut; +/Dfs) adult flies. b Deficiency strains were used in steps 1 and 2, followed by testing individual genes, using mutant and P-element insertion mutant fly lines (step 3). The number of genes tested (genes), number of fly strains (lines) used, and number of rescued lines (alive) are shown. c The identified mitorescue genes are shown, as well as their human homologs, and biological pathways. d Negative geotaxis test (NGT), measuring fly locomotion of tamas control (white), mutator (plum), and rescued (grey) flies 2 days after eclosure. Mean values of number of flies tested are shown. N = 3 biological replicates with 10 flies per replica. For tamas controls N = 10 biological replicates with 10 flies per replicates. e Crawling distance of third instar larvae from tamas control (white), mutator (plum), and rescued (grey) flies. Mean values of distance crawled per minute are shown. N = 10 biological replicates per genotype. f Relative mitochondrial respiratory chain enzyme activities in isolated mitochondria from third instar larvae. Measurements were performed for NADH:ubiquinone oxidoreductase (CI), NADH:cytochrome c oxidoreductase (CI  +  III), succinate:ubiquinone oxidoreductase (CII), succinate:cytochrome c oxidoreductase (CII  +  III), cytochrome c oxidase (CIV), and ATP synthase (CV). Tamas controls are shown in white, mutator in plum, atg2-mut in blue, tim14-mut in yellow, dilp1-mut in pink, and melted-mut in green. Mean values relative to tamas are shown. N  =  3 biologically independent samples per genotype. g Western blot analysis of protein extracts from third instar larvae, decorated with antibodies against the OXPHOS complex I subunit NDUFS3, and VDAC. h Quantification of (g). Men values of NDUFS3 relative to loading control (VDAC) are shown. Tamas controls are shown in white, mutator in plum, and rescued larvae in grey. N = 3 biological replica. i Representative images of TMRE staining (grey) of gut tissue from third instar larvae. Nuclei are stained with Hoechst (cyan). Scale bar = 9 μm. j Quantification of (i). Mean values of percentage of relative image intensity are shown. N = 10 images per genotype. Tamas controls are shown in white, mutator in plum, and rescued larvae in grey. k Aconitase activities in fresh mitochondria of third instar larvae. Mean values per μg of mitochondria are shown. Tamas controls are shown in white, mutator in plum, and rescued larvae in grey. N  =  3 biologically independent samples per genotype. Student’s two-tailed T-test was used with mutators (mut) against other genotypes, except for (d) where values were compared to tamas. P values < 0.05 are shown in bold. Error bars represent Standard deviation. Source data are provided in the main figure source data file.
Fig. 2
Fig. 2. mtDNA mutation load in mtDNA mutator and rescued flies.
a Relative mtDNA mutation load in third instar larvae, determined by random mutation capture assay (RMC). Mean values relative to tamas are shown. N = 6 biologically independent samples with 10 flies each per genotype and 3 technical replicates. b Relative mtDNA levels in third instar larvae, using ND6 as mtDNA and rp49 as nuclear targets. Mean values relative to tamas are shown. N = 3 biologically independent samples with 3 technical replicates for each genotype. c mtDNA mutation frequency determined by cloning and sequencing. Mean values per nucleotide sequenced are shown. For tamas, mutator, and atg2-mutator samples N = 2 biologically independent samples, with at least 180 clones sequenced per genotype were used. For melt-mutator N = 3 independent biological replicates were used. d Relative mtDNA mutation load in third instar larvae, determined by random mutation capture assay (RMC). Mean values relative to tamas are shown. N = 3 biologically independent samples with 10 flies each per genotype and 3 technical replicates. e Relative mtDNA levels in third instar larvae, using Cytb as mtDNA and rp49 as nuclear targets. Mean values relative to tamas are shown. N = 3 biologically independent samples with 3 technical replicates for each genotype. Tamas controls are shown in white, mutator in plum, and rescued larvae in grey. Student’s two-tailed T-test was used with mutators (mut) against other genotypes. P values < 0.05 are shown in bold. Error bars represent Standard deviation. Source data are provided in the main figure source data file.
Fig. 3
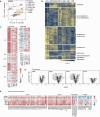
Fig. 3. Normalisation of the fly larvae proteome upon rescue.
a Principal components 1 and 2 of larval proteomes. Each dot is one sample. Colour overlay groups genotypes. b Expression of significantly different proteins (ANOVA, FDR < 0.01) as z-scores. Functional categories are significantly enriched gene ontologies (Fisher’s exact test, FDR < 0.05). Each column is one replicate. c LogFC of OXPHOS, assembly and accessory subunits relative to mutator larvae and pooled by genotype (n = 4). d Volcano plots of respective genotypes against mutator larvae proteomes with the proteasome category highlighted. e LogFC of proteins involved in mitochondrial translation relative to mutator larvae and pooled by genotype (n = 4). * indicates significant hits (multiple-testing adjusted p-values, FDR < 0.05).
Fig. 4
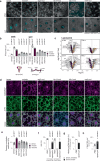
Fig. 4. Reduced mitochondrial mass in mtDNA mutator larvae.
a Relative abundance of the mitochondrial proteome normalised to the summed mean protein intensities in tamas. Data is presented as the larvae intensity ratio of mitochondrial proteins relative to tamas (ratio rel). wDah (pink), tamas (white) controls, mutator (plum), and rescued (grey) larvae are shown. N = 4 independent biological replicates. Boxplots represent the first and third quartile with median indicated. Whiskers represent the ±1.5 interquartile range. b Confocal images of the larval ventral nerve chord showing mitochondria in green (α-ATP-synthase) and nucleus in blue (DAPI). (Scale bar = 6 µm; Zoom = 1.8X). c Quantification of (b) with tamas (white) controls, mutator (plum), and rescued larvae (grey). Mean percentage of area fraction of mitochondria analysed. The average of ten independent images per genotype is shown. Student’s two-tailed T-test was used with mutators (mut) against other genotypes. P values < 0.05 are shown in bold. Error bars represent Standard deviation. N = 10 biological replicates per genotype. d Abundance of BNIP3 related peptides is shown for the genotypes as indicated. N = 4 independent biological replicates. Boxplots represent the first and third quartile with median indicated. Whiskers represent the ±1.5 interquartile range. wDah (pink), tamas (white) controls, mutator (plum), and rescued (grey) larvae are shown. e Volcano plots of respective genotypes against mutator larvae proteomes with the peroxisome category highlighted in plum (down) and yellow (up). Only rescued samples are shown. Control samples are shown in the supplementary files. f Transmission electron microscopy sections of third-instar larvae muscle. Top panels: section showing double membrane vesicular structures evocating autophagy figures in mutator larvae. These structures sometimes contact (mutator, arrows), or contain mitochondria (mutator, arrows). Bottom panels: higher magnification views. (arrows = autophagy like vesicle, M=mitochondria, MF= muscle fibre). Representative images from N = 3 biological replicates (20 images per replicate) are shown.
Fig. 5
Fig. 5. Increased macroautophagy in mtDNA mutator larvae.
a LysoTracker staining (grey) and Hoechst (cyan) in live brain tissue (CNS, top panels) and midgut cells (Bottom panels). Confocal images from brain and gut tissue from third instar fed larvae were taken directly after staining in lysosome-specific fluorescent and nucleus dye. Scale bar represents 10 µm. b Quantification of (a), showing the mean number of lysotracker foci per 100 μm2 in the brain (top panels) and gut (Bottom panels) from control (tamas, white), mutator (plum), and rescued (grey) larvae. N = 10 independent biological replicates per genotype. c Volcano plots of respective genotypes against mutator larvae proteomes with the Lysosome category highlighted in plum (down) and yellow (up). Selected significant hits (FDR < 0.05) are annotated. Only rescued samples are shown. Control data are shown in the supplementary files. d Confocal images of fat tissue after Gabarap immunostaining, showing, autophagosomes in magenta, mitochondria in green (α-ATP-synthase) and nucleus in blue (DAPI). (Scale bar = 10 µm; Zoom = 1.5X). e Quantification of (d), using the red and green signal presented by Pearson correlation coefficient (Rr). Tamas (white) controls, mutator (plum), and rescued (grey) larvae are shown. Mean values of Rr are shown. N = 15 independent biological replicates were used per genotype. f Pupation and hatching rates of control (tamas) flies grown in the presence of paraquat or rapamycin (black). PBS was used as control (white). Mean values of hatched flies from number of embryos seeded are shown. N = 10 biologically independent samples with 10 embryos/sample. g Relative mtDNA levels in second instar tamas larvae after rapamycin (400 μM) treatment (black), using Cytb as mtDNA and rp49 as nuclear targets. Mean values relative to PBS are shown (white). N = 3 biologically independent samples with 3 technical replicates per genotype. h Number of lysosomal foci in tamas middle midgut cells after 400 μM rapamycin treatment (black) or untreated (white). Mean number of lysosomal foci (visualised by LysoTracker) are represented per 100 μm2. Nuclei are stained by Hoechst staining. N = 10 independent biological replicates per genotype. Student’s two-tailed T-test was performed in comparison to mutator (mut) samples for (b) and (e) and PBS-treated samples for (f), (g), and (h). P values < 0.05 are shown in bold. Error bars represent Standard deviation. Source data are provided in the main figure source data file.
Fig. 6
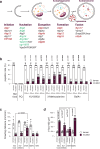
Fig. 6. Increased macroautophagy in mtDNA mutator larvae.
a Simplified scheme of the Drosophila autophagy pathway. Steps and involved genes are shown. Tested genes are coloured (red and green), with only green genes that rescued the mutator larva lethality. b Pupation rates after growing control and homozygous POLγexo- larvae in the presence of inhibitors specific to autophagy initiation (KU-55933), nucleation (3-methyladenine (3-MA)), or autolysosome formation (BafA1) at 3 different concentrations. PBS was used as control. Mean values of hatched flies from number of embryos seeded are shown. N = 10 biologically independent samples with 10 embryos/sample. c Crawling distance of third instar larvae grown in the presence of KU-55933, 3-MA and BafA1. Mean values of crawling distance in mm/min are shown. N = 10 biological replicates per genotype, except for tamas on standard food (N = 7), mutator on 3-MA (N = 12) and mutator on wortmannin (WM) (N = 9). d Quantification of lysosomal foci after LysoTracker and Hoechst staining in midgut cells from control and homozygous POLγexo- larvae grown in the presence of KU-55933, 3-MA and BafA1, showing the mean number of lysotracker foci per 100 μm2. N = 10 independent biological replicates per genotype, except for tamas on BafA1 (N = 9). Tamas controls in white and mutator in plum. Student’s two-tailed T-test was performed in comparison to tamas (standard food) for (b) and mutator (mut) (standard food) for (c) and (d). P values < 0.05 are shown in bold. Error bars represent Standard deviation. Source data are provided in the main figure source data file.

Similar articles

References

    1. Gorman, G. S. et al. Prevalence of nuclear and mitochondrial DNA mutations related to adult mitochondrial disease. Ann. Neurol.77, 753–759 (2015). - PMC - PubMed
    1. Suomalainen, A. & Battersby, B. J. Mitochondrial diseases: the contribution of organelle stress responses to pathology. Nat. Rev. Mol. Cell Biol.19, 77–92 (2018). - PubMed
    1. Payne, B. A. I. et al. Universal heteroplasmy of human mitochondrial DNA. Hum. Mol. Genet22, 384–390 (2012). - PMC - PubMed
    1. Stewart, J. B. & Chinnery, P. F. Extreme heterogeneity of human mitochondrial DNA from organelles to populations. Nat. Rev. Genet22, 106–118 (2020). - PubMed
    1. Yamamoto, K. et al. Genetic and phenotypic landscape of the mitochondrial genome in the Japanese population. Commun. Biol.3, 104 (2020). - PMC - PubMed

Publication types

LinkOut - more resources