. 2024 Dec 23;15(1):10722.
doi: 10.1038/s41467-024-55497-z.

Contributing factors to the oxidation-induced mutational landscape in human cells

Affiliations

Contributing factors to the oxidation-induced mutational landscape in human cells

Cameron Cordero et al. Nat Commun. .

Abstract

8-oxoguanine (8-oxoG) is a common oxidative DNA lesion that causes G > T substitutions. Determinants of local and regional differences in 8-oxoG-induced mutability across genomes are currently unknown. Here, we show DNA oxidation induces G > T substitutions and insertion/deletion (INDEL) mutations in human cells and cancers. Potassium bromate (KBrO3)-induced 8-oxoGs occur with similar sequence preferences as their derived substitutions, indicating that the reactivity of specific oxidants dictates mutation sequence specificity. While 8-oxoG occurs uniformly across chromatin, 8-oxoG-induced mutations are elevated in compact genomic regions, within nucleosomes, and at inward facing guanines within strongly positioned nucleosomes. Cryo-electron microscopy structures of OGG1-nucleosome complexes indicate that these effects originate from OGG1's ability to flip outward positioned 8-oxoG lesions into the catalytic pocket while inward facing lesions are occluded by the histone octamer. Mutation spectra from human cells with DNA repair deficiencies reveals contributions of a DNA repair network limiting 8-oxoG mutagenesis, where OGG1- and MUTYH-mediated base excision repair is supplemented by the replication-associated factors Pol η and HMCES. Transcriptional asymmetry of KBrO3-induced mutations in OGG1- and Pol η-deficient cells also demonstrates transcription-coupled repair can prevent 8-oxoG-induced mutation. Thus, oxidant chemistry, chromatin structures, and DNA repair processes combine to dictate the oxidative mutational landscape in human genomes.


Conflict of interest statement

Competing interests: The authors declare no competing interests.

Figures

Fig. 1
Fig. 1. Mutagenesis in hTERT RPE-1 p53-/- cells untreated and treated with 250 µM KBrO3 after 100 cell divisions.
A Schematic of experimental conditions for mutation accumulation, clonal isolation, WGS, and mutation calling. Image created with BioRender.com and licensed for publication under agreement number TD26OVBCYI. B Number of SNVs and INDELs per genome in untreated (NT) and KBrO3-treated (KBrO3) cells. Circles indicate biologically independent genomes sequenced (n = 4). Horizontal bars are median values. (* indicates p-value = 0.0286 by two-sided Mann-Whitney U test comparing KBrO3-treated to untreated clones) C SNV and D INDEL mutation signatures from treated and untreated genomes. E De novo generated INDEL signature found in human cancers containing greater than 25% of total mutations attributed to SBS18. Total mutations involved in each de novo generated INDEL signature are listed in Supplementary Fig. 4.
Fig. 2
Fig. 2. C > A mutation spectra and 8-oxodG lesion spectra in human cells under endogenous or KBrO3-induced DNA damage.
A Comparison of percentages of C > A trinucleotide mutation contexts from COSMIC SBS18 and KBrO3-induced mutations gave a cosine similarity of 0.812 and comparison with endogenous 8-oxodG lesion mapping gave a cosine similarity of 0.867. Comparison of KBrO3-induced mutations with KBrO3-induced 8-oxodG lesions gave a cosine similarity of 0.896. B Differential bar graphs display discrepancies in trinucleotide contexts percentages between SBS18 and KBrO3 mutations has a cosine similarity of 0.908 compared to the differential bar graphs displaying discrepancies between trinucleotide contexts from endogenous 8-oxodG lesions compared to endogenous KBrO3-induced 8-oxodG lesions.
Fig. 3
Fig. 3. Chromatin state, nucleosome binding, and transcription factor binding’s impact on 8-oxodG mutagenesis and lesion formation.
A Four binned broad regions are dictated by the ChromHMM map and within each group are sorted from left to right as being more heterochromatic to more euchromatic. The mean density of mutations and lesions are represented in blue bars (top graphs) and pink bars (bottom graphs), respectively. Error bars represent standard deviation and the circles represent biologically independent sequenced genomes (n = 4) or technical replicates of lesions (n = 2). Mutation rates in heterochromatin compared to other domains were significantly different for mutations. Precise p-values are indicated in the figure and were derived by Bonferroni-corrected two-sided paired t-test. B The left graphs represent translational periodicity of log2(observed/expected) of events between nucleosomes with mutations on top and lesion on the bottom. Nucleosome bound DNA is represented in blue and linker DNA is represented in red. The right two graphs represent the rotational periodicity of the log2(observed/expected) of events within the nucleosome where DNA that is inward facing relative to the nucleosome is displayed in gold while outward facing relative to the nucleosome is displayed in purple. A binomial fit of the data is overlayed in a dashed green line. In both figures, actual data points are displayed in gray. C Number of events are plotted relative to the TF binding midpoint for mutations on the left, lesions in the middle and UV-induced mutations occurring in dipyrimidine contexts from sequenced melanomas. Original data points are displayed in gray and a smoothed curve is overlayed in black.
Fig. 4
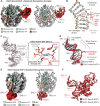
Fig. 4. Single particle analysis of OGG1-8-oxoG-NCP − 6.
A The 3.3 Å OGG1-8-oxoG-NCP − 6 composite cryo-EM map (left) and cartoon representation of the OGG1-8-oxoG-NCP − 6 model (right). B A diagram representing the interactions between OGG1 and the nucleosomal DNA in the OGG1-8-oxoG-NCP − 6 complex identified using PLIP. C Focused view of the nucleosomal DNA at SHL − 5.5 to SHL − 6.5 showing the extrahelical 8-oxoG at SHL − 6. The segmented density for the nucleosomal DNA in the OGG1-8-oxoG-NCP − 6 composite cryo-EM map is shown in transparent grey. An inset of the OGG1 active site is shown, highlighting key amino acids important for 8-oxoG recognition and excision. D Structural comparison of the nucleosomal DNA (SHL − 5.5 to SHL − 6.5) in the OGG1-8-oxoG-NCP − 6 complex and 8-oxoG-NCP − 6, highlighting the structural changes in the nucleosomal DNA induced by OGG1 binding. E The 3.6 Å OGG1-8-oxoG-NCP + 4 composite cryo-EM map (left) and cartoon representation of the OGG1-8-oxoG-NCP + 4 model (right). F Structural comparison of OGG1 and the nucleosomal DNA (SHL − 5.5 to SHL − 6.5) in the OGG1-8-oxoG-NCP − 6 and OGG1-8-oxoG-NCP + 4 complexes, highlighting the similarities in 8-oxoG recognition at both positions.
Fig. 5
Fig. 5. KBrO3-induced mutagenesis in human WT, POLH-/-, or HMCES-/- RPE-1 cells lines.
A Number of SNVs and INDELs per genome in KBrO3-treated for WT (n = 4), POLH-/- (n = 1), and HMCES-/- (n = 6) RPE-1 cells lines. Circles indicate independent genomes sequenced and horizontal bars are median values. Raw sequencing of the POLH-/- cell line obtained from was also reprocessed (indicated with an *) using BWA-mem and the consensus variant calling pipeline employed for the WT and HMCES-/- cells. KBrO3-associated B SNV and C INDEL mutation signatures from treated genomes.
Fig. 6
Fig. 6. KBrO3-induced 8-oxodG mutation and lesion strand bias on leading/lagging and transcribed/non-transcribed strands in human cells.
A Mean values of G > T, G > C, and G > A mutations on the leading strand (red bars) or on the lagging strand (blue bars). B Mean values of G > T, G > C, and G > A mutations on the non-transcribed strand (red bars) transcribed strand (blue bars). circles represent values from each biologically independent sequenced genome (n = 4, 6, and 1 for WT, HMCES-/-, and POLH-/-, respectively) or technical replicate measurements of KBrO3-induced lesions (n = 2). The bar graph below each plot represents the log2(red/blue) value of the for the event per Mb bars. Significant differences between strands are indicated with p-values determined by two-sided paired t-test for WT and HMCES-/- genomes. p-values (calculated using GraphPad Prism) for G base mutation types in the POLH-/- sample were calculated by two-sided Chi-square against the null hypothesis of equal representation of mutations on both DNA strands.
Fig. 7
Fig. 7. Mechanisms that limit KBrO3-induced 8-oxodG mutagenesis in human cells.
Mutations from 8-oxoG can be limited in human cells by OGG1- and MUTYH-initiated BER. Secondary limits on mutagenesis include Pol η, HMCES, and transcription-coupled repair. Dashed lines represent multi-step processes. Image created with BioRender.com under agreement number DX26OBAXYI.

References

    1. Dizdaroglu, M. Oxidatively induced DNA damage and its repair in cancer. Mutat. Res Rev. Mutat. Res. 763, 212–245 (2015). - PubMed
    1. Nakamura, J. et al. The endogenous exposome. DNA Repair (Amst.)19, 3–13 (2014). - PMC - PubMed
    1. Swenberg, J. A. et al. Endogenous versus exogenous DNA adducts: their role in carcinogenesis, epidemiology, and risk assessment. Toxicol. Sci.120, S130–S145 (2011). - PMC - PubMed
    1. Kawanishi, S. & Murata, M. Mechanism of DNA damage induced by bromate differs from general types of oxidative stress. Toxicology221, 172–178 (2006). - PubMed
    1. Zhivagui, M. et al. DNA damage and somatic mutations in mammalian cells after irradiation with a nail polish dryer. Nat. Commun.14, 276 (2023). - PMC - PubMed

Publication types