. 2024 Dec 23;15(1):10713.
doi: 10.1038/s41467-024-54659-3.

Chromosome architecture and low cohesion bias acrocentric chromosomes towards aneuploidy during mammalian meiosis

Affiliations

Chromosome architecture and low cohesion bias acrocentric chromosomes towards aneuploidy during mammalian meiosis

Eirini Bellou et al. Nat Commun. .

Abstract

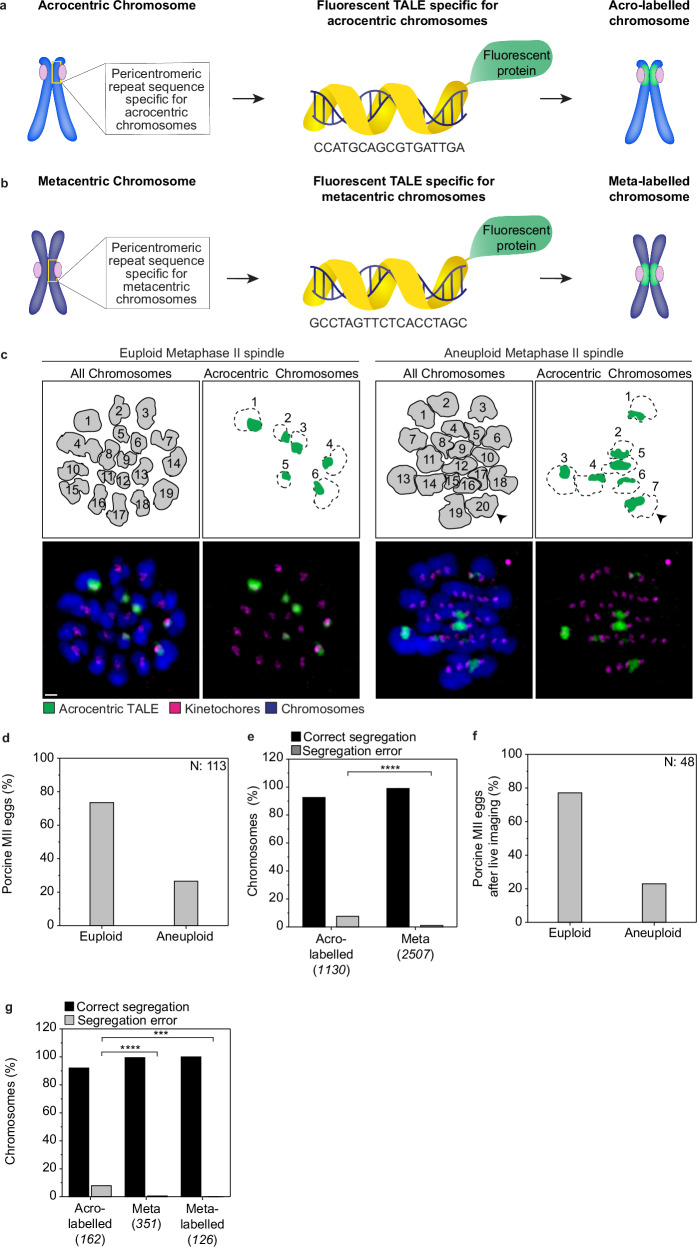
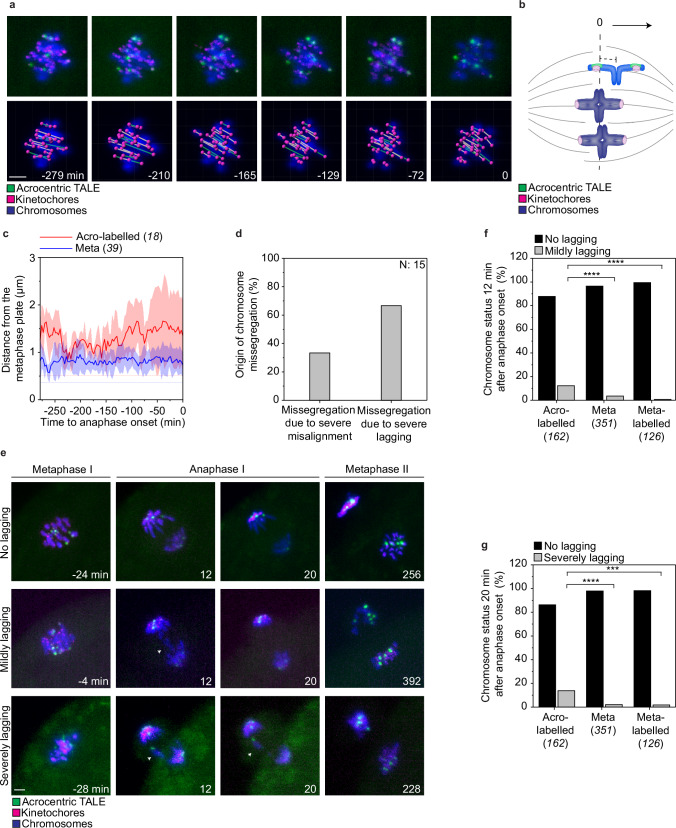
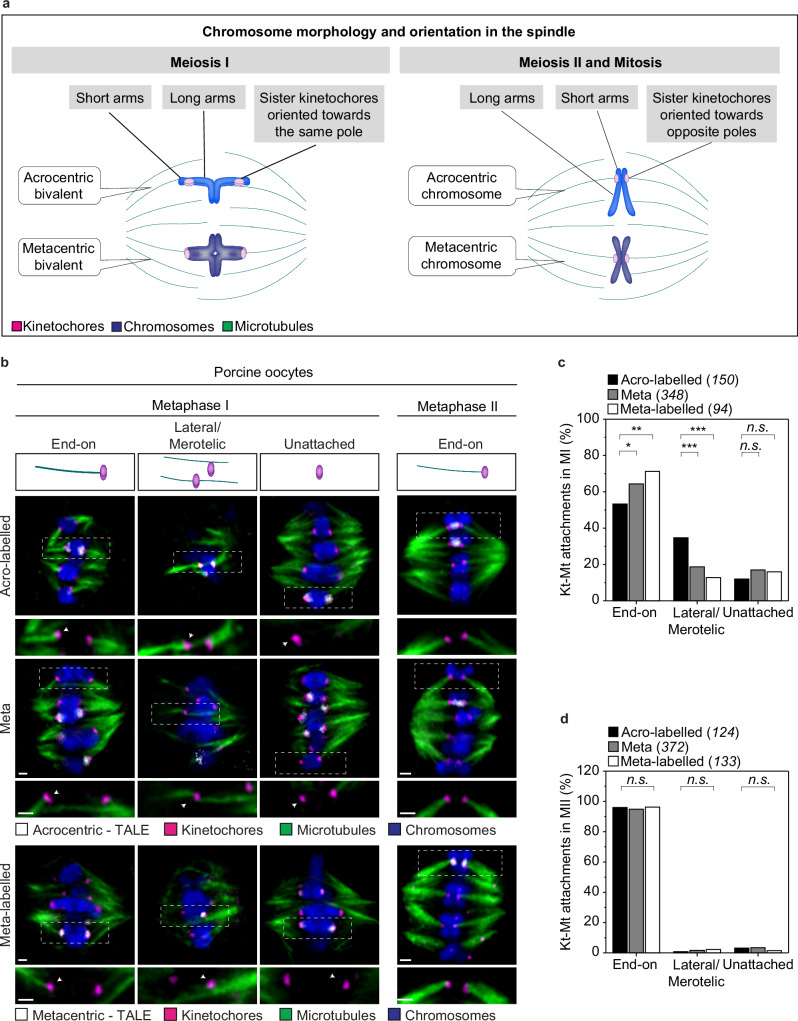
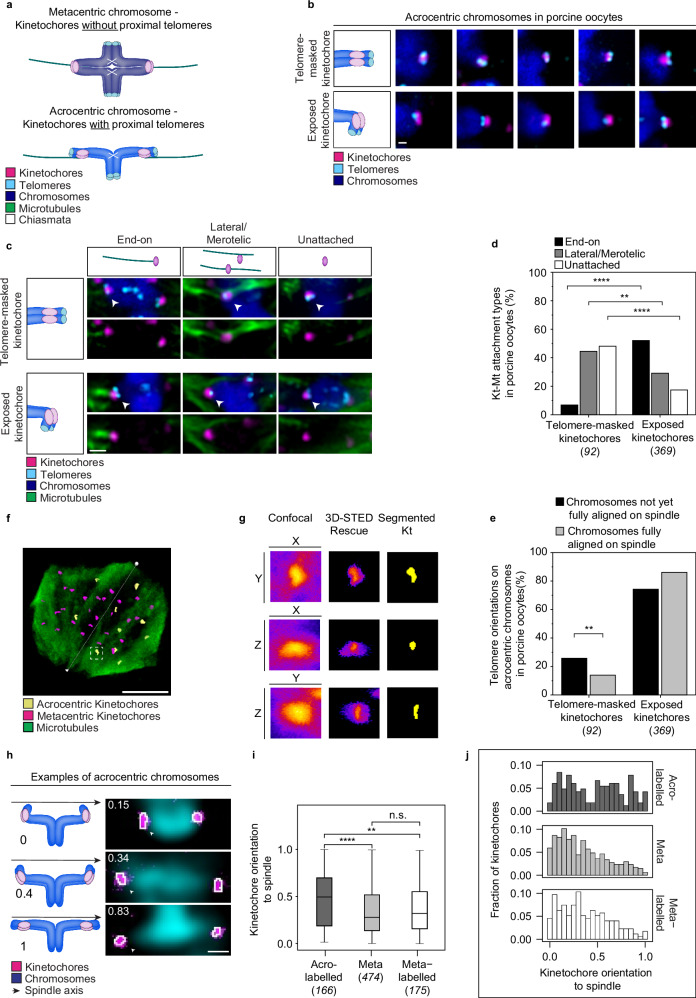
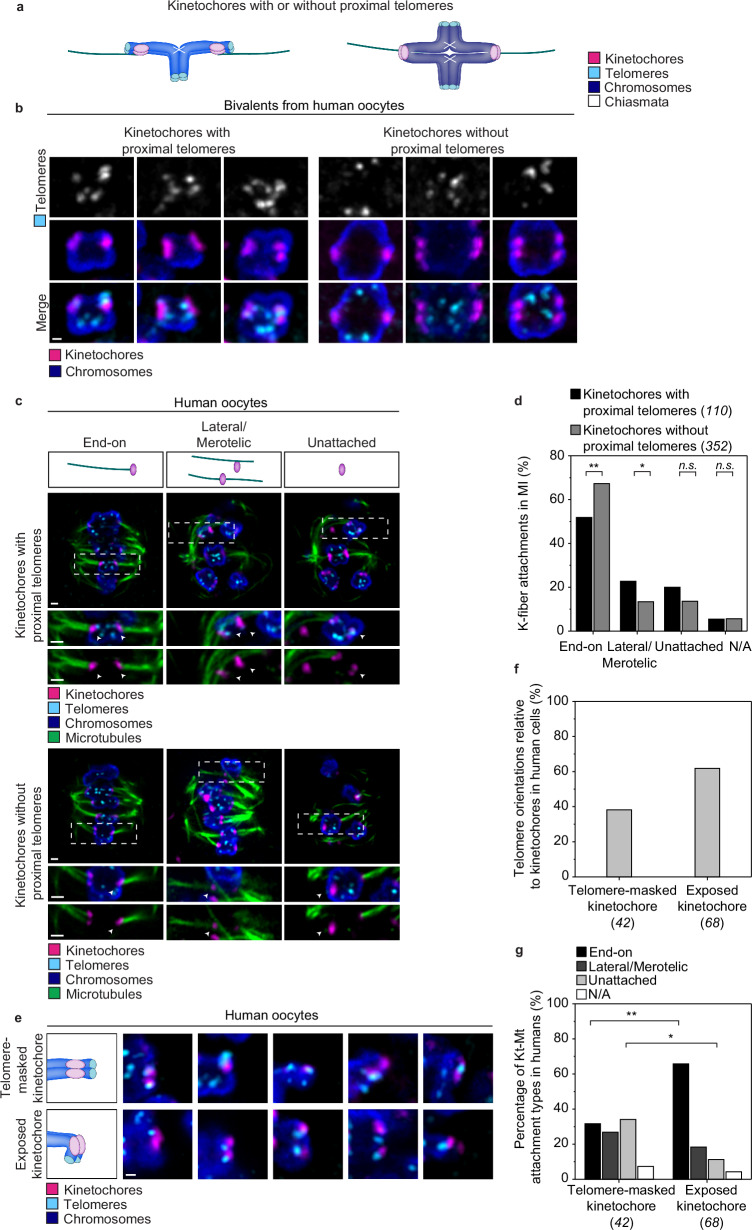
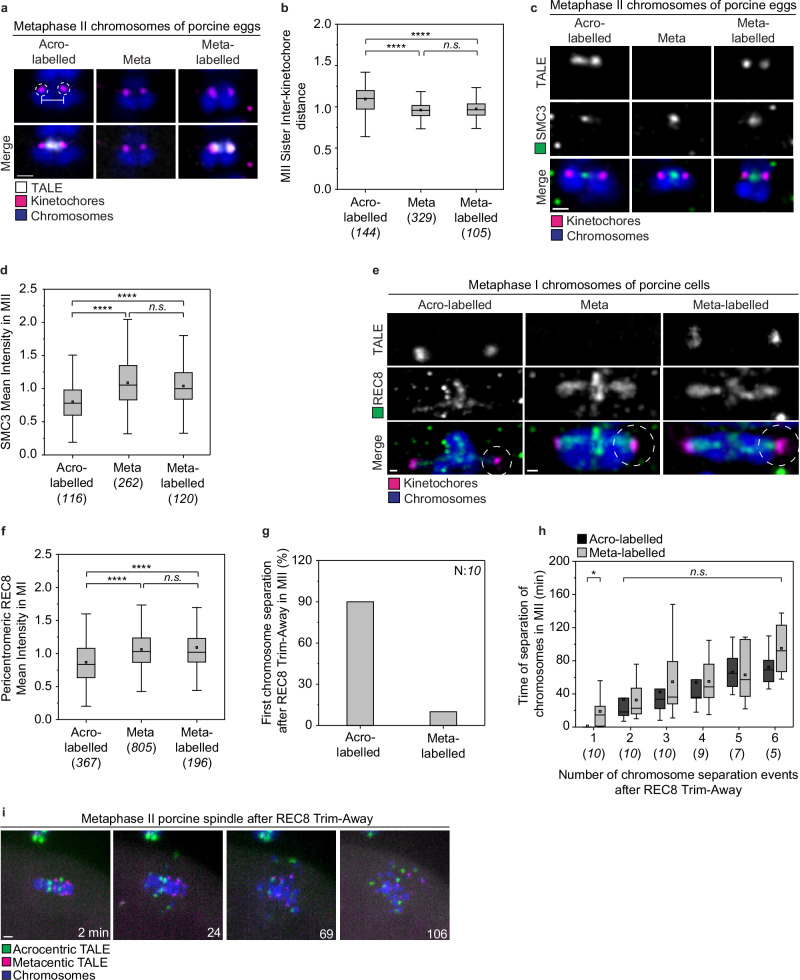
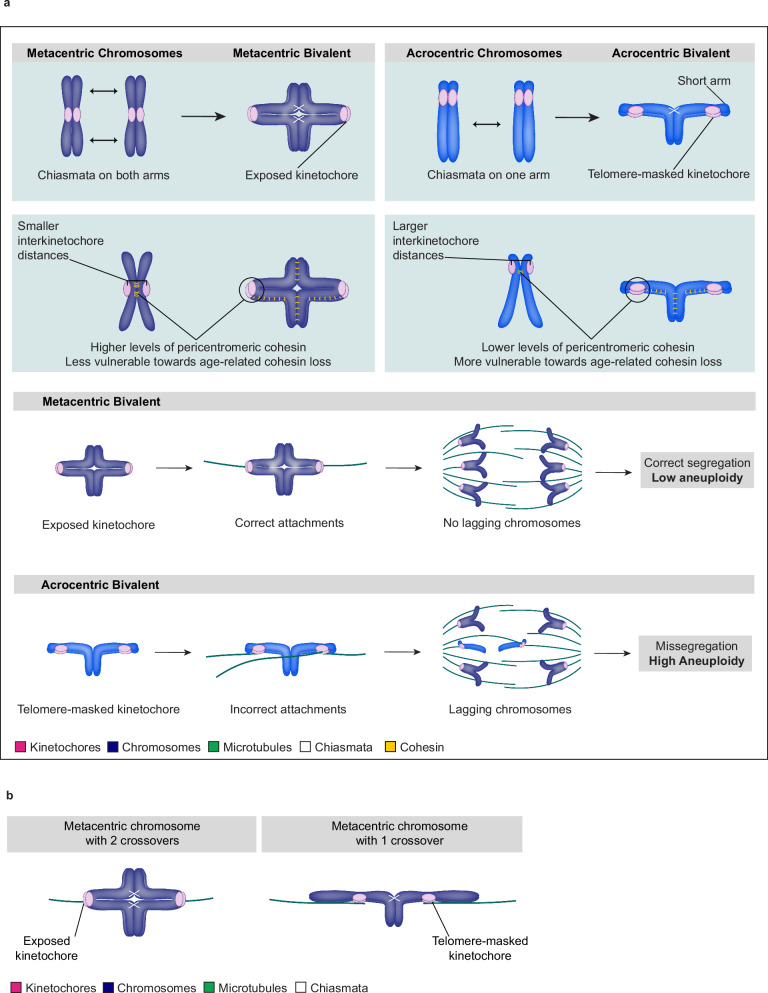
Aneuploidy in eggs is a leading cause of miscarriages or viable developmental syndromes. Aneuploidy rates differ between individual chromosomes. For instance, chromosome 21 frequently missegregates, resulting in Down Syndrome. What causes chromosome-specific aneuploidy in meiosis is unclear. Chromosome 21 belongs to the class of acrocentric chromosomes, whose centromeres are located close to the chromosome end, resulting in one long and one short chromosome arm. We demonstrate that acrocentric chromosomes are generally more often aneuploid than metacentric chromosomes in porcine eggs. Kinetochores of acrocentric chromosomes are often partially covered by the short chromosome arm during meiosis I in human and porcine oocytes and orient less efficiently toward the spindle poles. These partially covered kinetochores are more likely to be incorrectly attached to the spindle. Additionally, sister chromatids of acrocentric chromosomes are held together by lower levels of cohesin, making them more vulnerable to age-dependent cohesin loss. Chromosome architecture and low cohesion therefore bias acrocentric chromosomes toward aneuploidy during mammalian meiosis.


Conflict of interest statement

Competing interests: The authors declare no competing interests.

Figures

Fig. 1
Fig. 1. Acrocentric chromosomes missegregate more often than metacentric chromosomes in porcine oocytes.
a, b Schematic representation of the labelling strategy with the pericentromeric TALEs in the porcine cells. The region recognised by each TALE is indicated for each chromosome type. TALEs are fused with a fluorescent protein. Labelled chromosomes are referred to as acro-labelled and meta-labelled, respectively. Blue, chromosomes; magenta, kinetochores; yellow, TALE; green, fluorescent protein, and TALE on chromosomes. c Representative immunofluorescence images of a spindle from a euploid and an aneuploid intact fixed metaphase II egg injected with the acrocentric-TALE, (bottom row). Numbers within the grey illustrations indicate the number of chromosomes in each of the two spindles (top row). Numbers next to the green illustrations indicate the number of acro-labelled chromosomes in both the euploid and aneuploid cells. The black arrowheads indicate the extra acro-labelled chromosome. Scale bar, 1 μm. Representative examples of 96 immunolabelled porcine eggs. d The fraction of aneuploid eggs from the total of analysed fixed metaphase II porcine eggs. Aneuploid eggs were identified by kinetochore counting (113 eggs analysed). e Frequency of missegregation for acro-labelled and meta chromosomes from the total chromosomes counted in each category. Counting was performed in fixed metaphase II porcine spindles injected with the acrocentric-TALE (96 eggs analysed). Two-sided Fisher’s exact test (p < 0.0001). f Proportion of euploid and aneuploid metaphase II porcine eggs after live-cell imaging. Euploidy status is determined by the correct or erroneous segregation outcome of the chromosomes during live imaging (48 eggs analysed). g Frequency of missegregation per chromosome group after live-cell imaging (48 eggs analysed). Two-sided Fisher’s exact test (acro-labelled/meta, p < 0.0001; acro-labelled/meta-labelled, p = 0.003). The number of chromosomes analysed is indicated in brackets under each category. P-values in the graphs are indicated as follows, ***p < 0.001 and ****p < 0.0001. The number of cells is indicated with N in the graph or in brackets in the figure legend.
Fig. 2
Fig. 2. Acrocentric chromosomes are more likely to misalign during late metaphase and lag during anaphase.
a Still images from time-lapse movies of porcine oocytes during chromosome alignment at the metaphase plate (top row) and the corresponding image from Imaris with the pairing annotation (bottom row). Time is indicated in minutes and time point 0 is the last frame before anaphase onset. Magenta, kinetochores (mScarlet-hCENPC); green, acrocentric label, (Acrocentric-TALE-GFP); blue, chromosomes, (H2B-SNAPf) in the top row and magenta, kinetochores; green line, pair of homologous acro-labelled kinetochores; white line, pair of homologous meta kinetochores. Scale bar, 1 μm. b Schematic representation shows measurements of a bivalent’s distance from the metaphase plate. The Acro-labelled chromosome is outside the centre of the metaphase plate and meta chromosomes align in the middle of the metaphase plate. Magenta, kinetochores; green, acrocentric-TALE; blue, chromosomes; grey, spindle. c Quantifications of the distance of acro-labelled and meta bivalents from the centre of the metaphase plate. Error bars (shaded areas) represent SD (3 oocytes analysed). d Proportion of the different types of segregation errors from the chromosomes that clearly missegregated during live-cell imaging of anaphase. In the category “Missegregation due to severe misalignment” are chromosome pairs that were severely misaligned at anaphase onset and remained at this position during anaphase, and hence both chromosomes of the pair were located either in the egg or the polar body; in the category “Missegregation due to severe lagging” are chromosome pairs that severely lagged behind during anaphase and eventually failed to segregate, with both chromosomes again located together in the egg or the polar body (48 oocytes analysed). e Still images from a time-lapse movie of chromosome segregation in porcine oocytes. Images from metaphase I, anaphase I, and metaphase II. Time is indicated in minutes and time point 0 is the last frame before anaphase onset. Arrowheads indicate lagging chromosomes. Magenta, kinetochores (mScarlet-hCENPC); green, acrocentric label, (Acrocentric-TALE-GFP); blue, chromosomes, (H2B-SNAPf). Scale bar, 1 μm. f Frequency of mildly lagging chromosomes (12 min after anaphase onset) from the total chromosomes examined (48 oocytes analysed). Two-sided Fisher’s exact test (acro-labelled/meta, p < 0.0001; acro-labelled/meta-labelled, p < 0.0001). g Frequency of severely lagging chromosomes (20 min after anaphase onset) from total chromosomes examined (48 oocytes analysed). Two-sided Fisher’s exact test (acro-labelled/meta, p < 0.0001; acro-labelled/meta-labelled, p = 0.0003). Number of chromosomes analysed is indicated in brackets next to each category or with N inside the graph. P-values in the graphs are indicated as follows, ***p < 0.001 and ****p < 0.0001. The number of cells is indicated in brackets in the figure legend.
Fig. 3
Fig. 3. Porcine acrocentric chromosomes frequently form erroneous kinetochore-microtubule attachments.
a Schematic illustration of the chromosome morphologies and the orientation in the spindle. Examples of acrocentric and metacentric chromosomes in meiosis I and meiosis II/mitosis. The small arm of acrocentric chromosomes and the orientation of the sister kinetochores are indicated in both cases. b Illustrations and representative immunofluorescence images of kinetochore-microtubule attachments from cold-treated porcine oocytes in Metaphase I (left side) and Metaphase II (right-side). Overview images of a z-plane of the full spindle (top row) and insets of the attachments (bottom row). Insets are magnifications of regions marked by dashed line boxes in the overview image. Magenta, kinetochores, (ACA); grey, TALE, (anti-GFP); blue, chromosome, (Hoechst); green microtubules (anti-a-tubulin). Scale bar, 1 μm for both overview and insets. c Quantification of the proportion of kinetochore-microtubule (Kt-Mt) attachments for acro-labelled, meta, and meta-labelled chromosomes in meiosis I spindles in porcine oocytes. The number of attachments quantified per chromosome type is indicated in brackets (25 oocytes analysed). Two-sided Fisher’s exact test (end-on: acro-labelled/meta, p = 0.0216; end-on: acro-labelled/meta-labelled, p = 0.007; latera/merotelic: acro-labelled/meta, p = 0.0002; latera/merotelic: acro-labelled/meta-labelled, p = 0.0002; unattached: acro-labelled/meta, p = 0.1783; unattached: acro-labelled/meta-labelled, p = 0.4426). d Quantification of the proportion of kinetochore-microtubule (Kt-Mt) attachments for acro-labelled, meta, and meta-labelled chromosomes in meiosis II spindles in porcine oocytes. The number of attachments quantified per chromosome type is indicated in brackets (26 cells analysed). Two-sided Fisher’s exact test (end-on: acro-labelled/meta, p = 0.8101; end-on: acro-labelled/meta-labelled, p = 1.000; latera/merotelic: acro-labelled/meta, p = 0.6862; latera/merotelic: acro-labelled/meta-labelled, p = 0.6230; unattached: acro-labelled/meta, p = 1.0000; unattached: acro-labelled/meta-labelled, p = 0.4332). Number of kinetochores analysed is indicated in brackets. P-values in the graphs are indicated as follows, *p < 0.05, **p < 0.01, ***p < 0.001 and n.s.: non-significant. The number of cells is indicated in brackets in the figure legend.
Fig. 4
Fig. 4. Kinetochores partially masked by the small chromosome arm are more likely to be incorrectly attached to microtubules.
a Illustrations show differences in the telomere’s position with respect to the kinetochore in acrocentric and metacentric bivalents when aligned in a metaphase plate. Differences in the lengths of the arms result in differences in the distance of the telomeres from the kinetochores in the two morphologies. Magenta, kinetochores; cyan, telomeres; blue, chromosomes; green, spindle axis; white, chiasmata. b Illustrations and representative Airyscan immunofluorescence images with telomere-masked kinetochores (top row) and exposed kinetochores (bottom row) in porcine oocytes. Magenta, kinetochores, (ACA); cyan, telomeres, (TRF-2); blue, chromosomes, (Hoechst). Scale bar, 0.5 μm. Representative examples of 44 immunolabelled porcine oocytes. c Illustrations and representative Airyscan immunofluorescence images from the attachment types of telomere-masked and exposed kinetochores in porcine oocytes. Arrowheads indicate the specified attachment type. Magenta, kinetochores, (ACA); cyan, telomeres, (TRF-2); blue, chromosomes, (Hoechst); green, microtubules, (a-tubulin). Scale bar, 1 μm. Representative examples of 44 immunolabelled porcine oocytes. d Quantification of the proportion of kinetochore-microtubule (Kt-Mt) attachments for telomere-masked and exposed kinetochores of acrocentric chromosomes in porcine oocytes (44 oocytes analysed). Two-sided Fisher’s exact test (end-on, p < 0.0001; latera/merotelic, p = 0.0087; unattached, p < 0.0001). e Distribution of telomere-masked and exposed kinetochores of acrocentric chromosomes on spindles with fully aligned chromosomes and spindles that have not yet aligned their chromosomes (44 oocytes analysed). Two-sided Fisher’s exact test (p = 0.0016). f Rendering of segmented acro-labelled kinetochores (yellow, TALE labelled) and non-labelled kinetochores (magenta) in a meiotic metaphase spindle (microtubules in green). The white arrow indicates the spindle direction. Scale bar, 5 μm. Representative examples of 32 immunolabelled porcine oocytes. g Magnification of the kinetochore shown in F, white square, and the corresponding confocal, 3D-STED, and segmented kinetochores in XY, XZ, and YZ views. Each tile is 2 × 2 μm. h Illustrations and representative images of different angles of kinetochores in acrocentric chromosomes. The black arrow on the left side represents the spindle axis. The numbers in each image are the dot products between the left kinetochore longest axis and spindle axis. Magenta, kinetochores; blue, chromosomes; black, spindle axis. i Box plot showing the kinetochore orientation to the spindle for the three kinetochore populations (32 oocytes analysed). Box plot shows the median (horizontal black line), mean (small black squares), 25th and 75th percentile (boxes), and outliers (whiskers). Wilcoxon two-tailed test, (acro-labelled/meta, p = 2.38e − 06; acro-labelled/meta-labelled, p = 0.002; meta/meta-labelled, p = 0.181). j Distribution of the dot-product for the kinetochore orientation to the spindle for acro-labelled (upper graph), meta (middle graph), and meta-labelled kinetochores (lower graph) (32 oocytes analysed). Number of kinetochores analysed is indicated in brackets next to each category. P-values in the graphs are indicated as follows, **p < 0.01, ****p < 0.0001, and n.s.: non-significant. The number of cells is indicated in brackets in the figure legend.
Fig. 5
Fig. 5. Human acrocentric chromosomes frequently form erroneous kinetochore-microtubule attachments.
a Schematic representation of bivalents kinetochores with telomeres in proximity and with kinetochores without telomere in proximity. Chromosomes in blue; kinetochores in magenta; telomeres in cyan; chiasmata in white. b Representative examples of immunofluorescence Airyscan images of human bivalents with kinetochores with telomeres in proximity and kinetochores without telomeres in proximity. Bivalent chromosomes are expected to have 8 telomeres, but in some cases, subsets of telomeres are in close proximity of each other so that fewer than 8 spots are detected Magenta, kinetochores, (ACA); cyan, telomeres, (TRF-2); blue, chromosome, (pH3). Scale bar, 0.5 μm. Representative examples of chromosomes from 10 immunolabelled human oocytes. c Illustrations and representative immunofluorescence images of kinetochore-microtubule attachments from cold-treated human oocytes in meiosis I. Overview images of a z-plane of the spindle (top row) and insets of the attachments at the bottom rows. Insets are magnifications of regions marked by dashed line boxes in the overview image. Arrowheads indicate the specified attachment type. Magenta, kinetochores, (ACA); cyan, telomeres, (TRF-2); blue, chromosome, (pH3); green microtubules (a-tubulin). Scale bar, 1 μm for both overview and insets. d Quantification of the proportion of the different kinetochore-microtubule attachments in kinetochores with telomeres in proximity and kinetochores without telomere in proximity (10 oocytes analysed). Two-sided Fisher’s exact test (end-on, p = 0.0044; lateral/merotelic, p = 0.0235; unattached, p = 0.1268; N/A, p = 1.000). e Illustrations and representative immunofluorescence images with telomere-masked kinetochores (top row) and exposed kinetochores (bottom row) from human oocytes. Magenta, kinetochores, (ACA); cyan, telomeres, (TRF-2); blue, chromosomes, (Hoechst). Scale bar 0.5 μm. f Proportion of telomere-masked and exposed kinetochores in acrocentric chromosomes from the total kinetochores of acrocentric chromosomes examined (10 oocytes analysed). g Quantification of the proportion of the different kinetochore-microtubule (Kt-Mt) attachment types for telomere-masked and exposed kinetochores of acrocentric chromosomes in human oocytes (10 oocytes analysed). Two-sided Fisher’s exact test (end-on, p = 0.0017; unattached, p = 0.0160). Number of chromosomes or kinetochores analysed is indicated in brackets under each category. P-values in the graphs are indicated as follows, *p < 0.05, **p < 0.01, ***p < 0.001, and n.s.: non-significant. The number of cells is indicated in brackets in the figure legend.
Fig. 6
Fig. 6. Pig acrocentric chromosomes have less cohesin than metacentric chromosomes.
a Representative Airyscan immunofluorescence images of the measurements from the sister chromatids in the three different chromosome groups. Magenta, kinetochores, (ACA); grey, TALE (anti-GFP); blue, chromosomes, (Hoechst); Dashed circles indicate the sister kinetochores and the white line indicates the distance measured. Scale bar, 1 μm. b Box plot showing measurements of the interkinetochore distance of sister chromatids on metaphase II intact spindles of porcine oocytes (41 oocytes analysed). Box plot shows the median (horizontal black line), mean (small black squares), 25th and 75th percentile (boxes), and outliers (whiskers). Two-tailed unpaired t-test was performed (acro-labelled/meta, p = 1.41075e − 8; acro-labelled/meta-labelled, p = 7.51899e − 9; meta/meta-labelled, p = 0.31898). c Representative Airyscan immunofluorescence images of the SMC3 staining on chromosomes in metaphase II intact spindles of porcine eggs. Single z-plane images from the three different chromosome groups. Magenta, kinetochores, (ACA); grey, TALE (anti-GFP); blue, chromosomes, (Hoechst); green, cohesin, (anti-SMC3); Scale bar, 1 μm. d Box plot showing mean intensity measurements of SMC3 signal on chromosomes from metaphase II intact spindles of porcine eggs (40 oocytes analysed). Box plot shows the median (horizontal black line), mean (small black squares), 25th and 75th percentile (boxes), and outliers (whiskers). Two-tailed unpaired t-test was performed, (acro-labelled/meta, p = 6.11772e − 7; acro-labelled/meta-labelled, p = 2.04894e − 4; meta/meta-labelled, p = 0.37062). e Representative Airyscan immunofluorescence images of the REC8 staining on chromosomes from metaphase I intact spindles of porcine oocytes. Images from the three different chromosome groups. Images are projections of 16 z-planes. Dashed circles indicate the area of the measurements. Magenta, kinetochores, (ACA); grey, TALE (anti-GFP); blue, chromosomes, (Hoechst); green, cohesion, (anti-REC8); Scale bars, 0.5 μm. f Box plot of mean intensity measurements of REC8 intensity around the pericentromeric areas on chromosomes from metaphase I intact spindles of porcine oocytes (49 oocytes analysed). Box plot shows the median (horizontal black line), mean (small black squares), 25th and 75th percentile (boxes), and outliers (whiskers). Two-tailed unpaired t-test was performed (acro-labelled/meta, p = 3.89493e − 24; acro-labelled/meta-labelled, p = 1.41981e − 13; meta/meta-labelled, p = 0.20548). g Percentage of the first chromosome to separate after Trim-Away of REC8 in metaphase II porcine eggs. h Time of separation for each of the six acro-labelled and meta-labelled chromosomes after Trim-Away of REC8 in porcine eggs. As time point zero in each egg is the time of the first chromosome separation (10 oocytes analysed). Box plot shows the median (horizontal black line), mean (small black squares), 25th and 75th percentile (boxes), and outliers (whiskers). Two-tailed unpaired t-test was performed between each separation event for acro-labelled and meta-labelled (1st separation, p = 0.01326; 2nd separation, p = 0.96525; 3rd separation, p = 0.47748;4th separation, p = 0.94742, 5th separation, p = 0.82915, 6th separation, p = 0.2905). i Still images from a time-lapse movie after Trim-Away of REC8 in metaphase II porcine eggs. Time is indicated in minutes and time point 0 is the first frame when imaging started after the injection of the REC8 antibody. Magenta, Metacentric-TALE (Metacentric-TALE-GFP); green, acrocentric label, (Acrocentric-TALE-mScarlet); blue, chromosomes, (H2B-SNAPf). Scale bar, 1 μm. Number of chromosomes analysed is indicated in brackets under each category. P-values in the graphs are indicated as follows, *p < 0.05, ****p < 0.0001, and n.s.: non-significant. The number of cells is indicated in brackets in the figure legend.
Fig. 7
Fig. 7. Kinetochore masking and weak cohesion promote high aneuploidy of acrocentric chromosomes during mammalian meiosis.
a Scheme summarising how differences in acro- and metacentric chromosome bivalent morphology in meiosis I, and lower levels of pericentromeric cohesin in acrocentric chromosomes bias acrocentric chromosomes toward aneuploidy. b Model proposing an explanation for the necessity of metacentric chromosomes to form a chiasma on each of the two arms.

Similar articles

Cited by

References

    1. Charalambous, C., Webster, A. & Schuh, M. Aneuploidy in mammalian oocytes and the impact of maternal ageing. Nat. Rev. Mol. Cell Biol. 24, 27–44 (2023). - PubMed
    1. Verlhac, M. H. & Terret, M. E. Oocyte maturation and development. F1000Res5, F1000 Faculty Rev-309 (2016). - PMC - PubMed
    1. Gruhn, J. R. et al. Chromosome errors in human eggs shape natural fertility over reproductive life span. Science365, 1466–1469 (2019). - PMC - PubMed
    1. Herbert, M., Kalleas, D., Cooney, D., Lamb, M. & Lister, L. Meiosis and maternal aging: insights from aneuploid oocytes and trisomy births. Cold Spring Harb. Perspect. Biol.7, a017970 (2015). - PMC - PubMed
    1. Webster, A. & Schuh, M. Mechanisms of aneuploidy in human eggs. Trends Cell Biol.27, 55–68 (2017). - PubMed

Publication types

LinkOut - more resources