. 2024 Dec 23;15(1):832.
doi: 10.1007/s12672-024-01712-8.

Integrated analysis of cell cycle and p53 signaling pathways related genes in breast, colorectal, lung, and pancreatic cancers: implications for prognosis and drug sensitivity for therapeutic potential

Affiliations

Integrated analysis of cell cycle and p53 signaling pathways related genes in breast, colorectal, lung, and pancreatic cancers: implications for prognosis and drug sensitivity for therapeutic potential

Jiyauddin Khan et al. Discov Oncol. .

Abstract

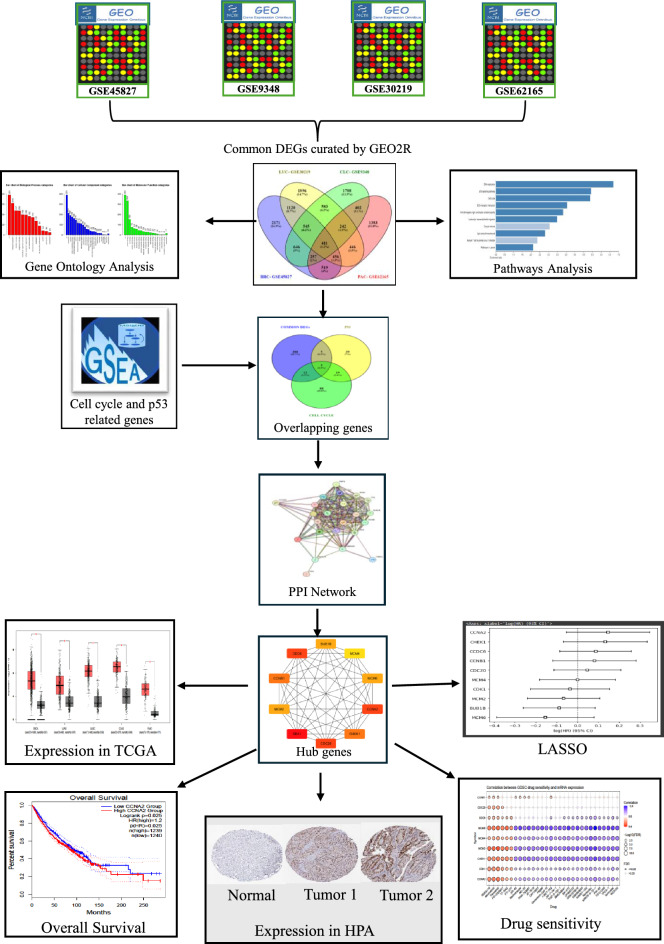
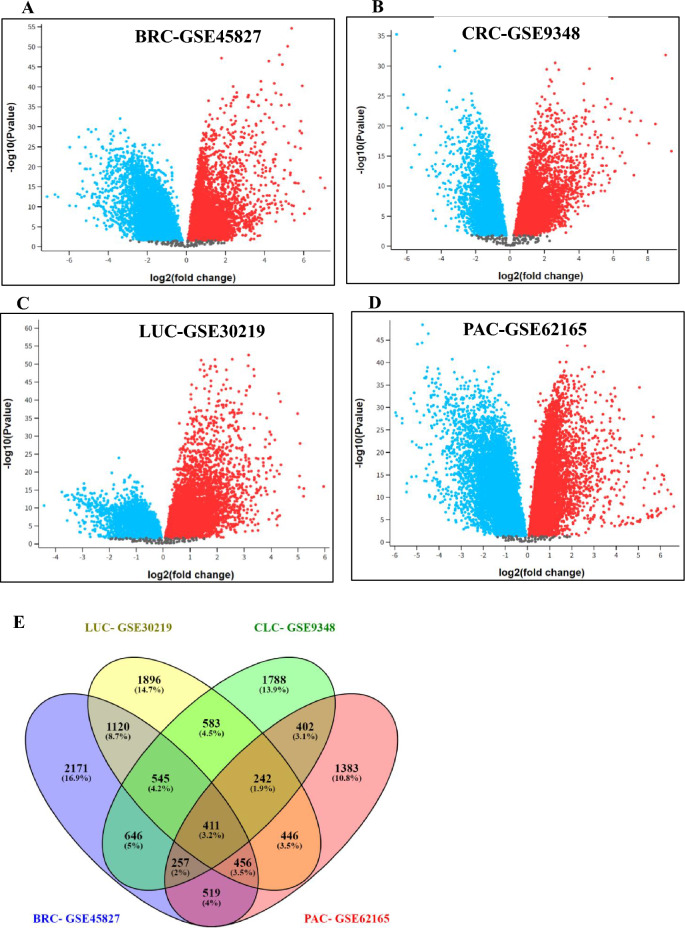
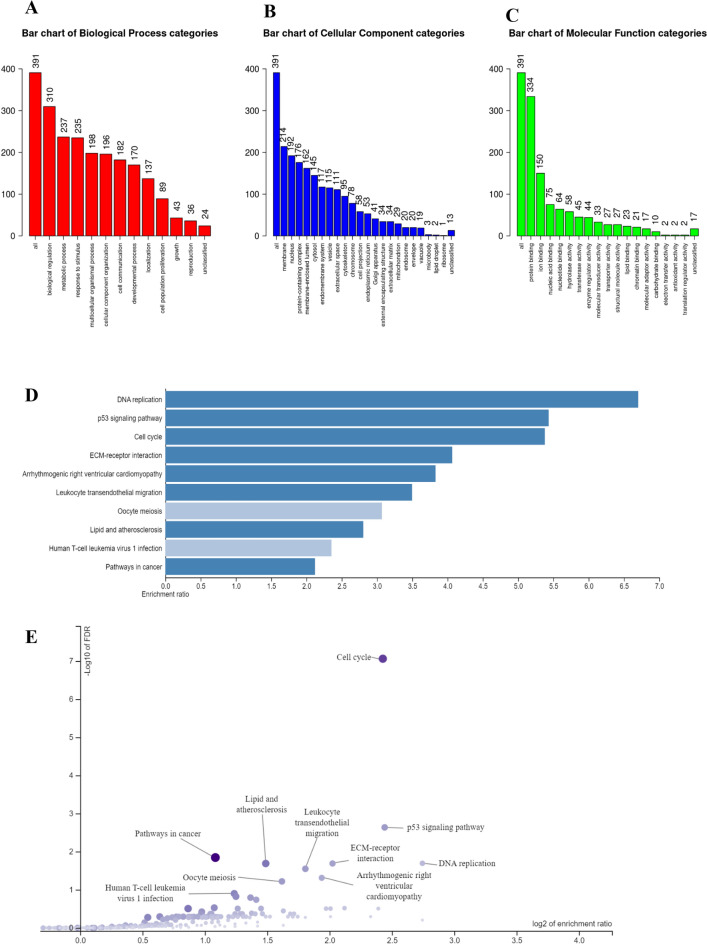
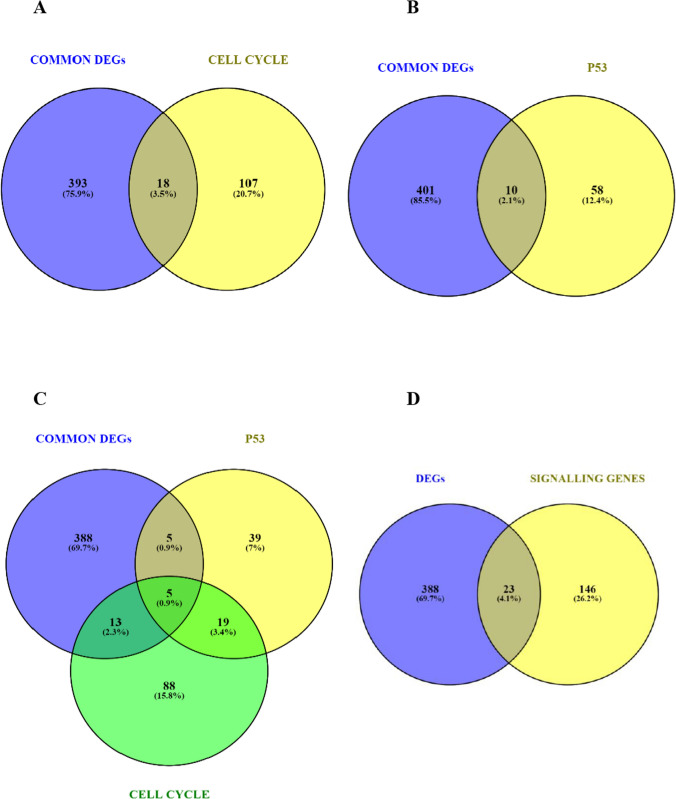
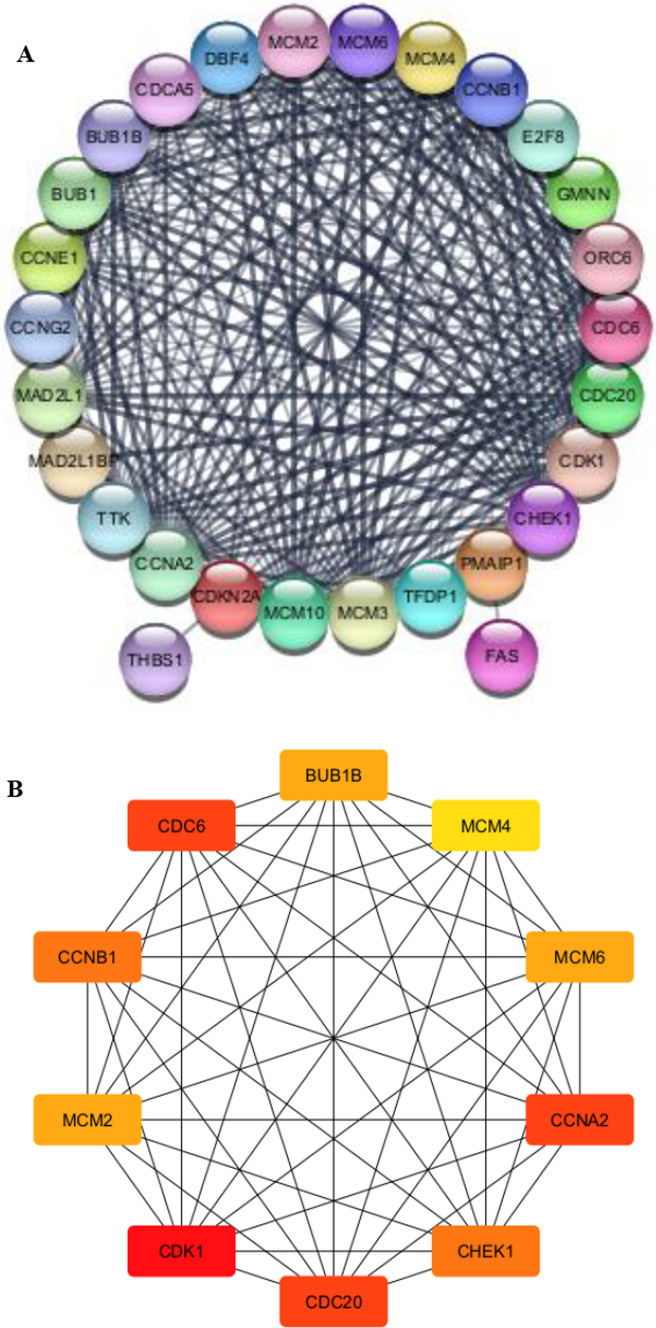
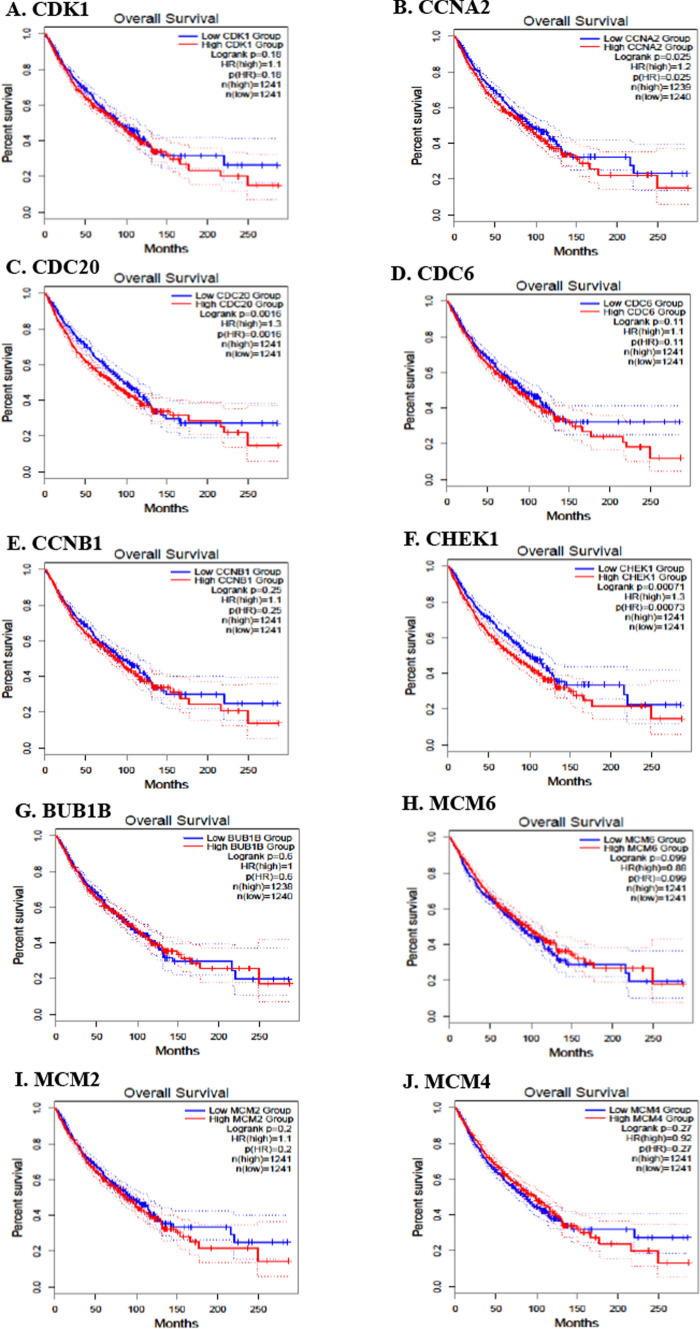
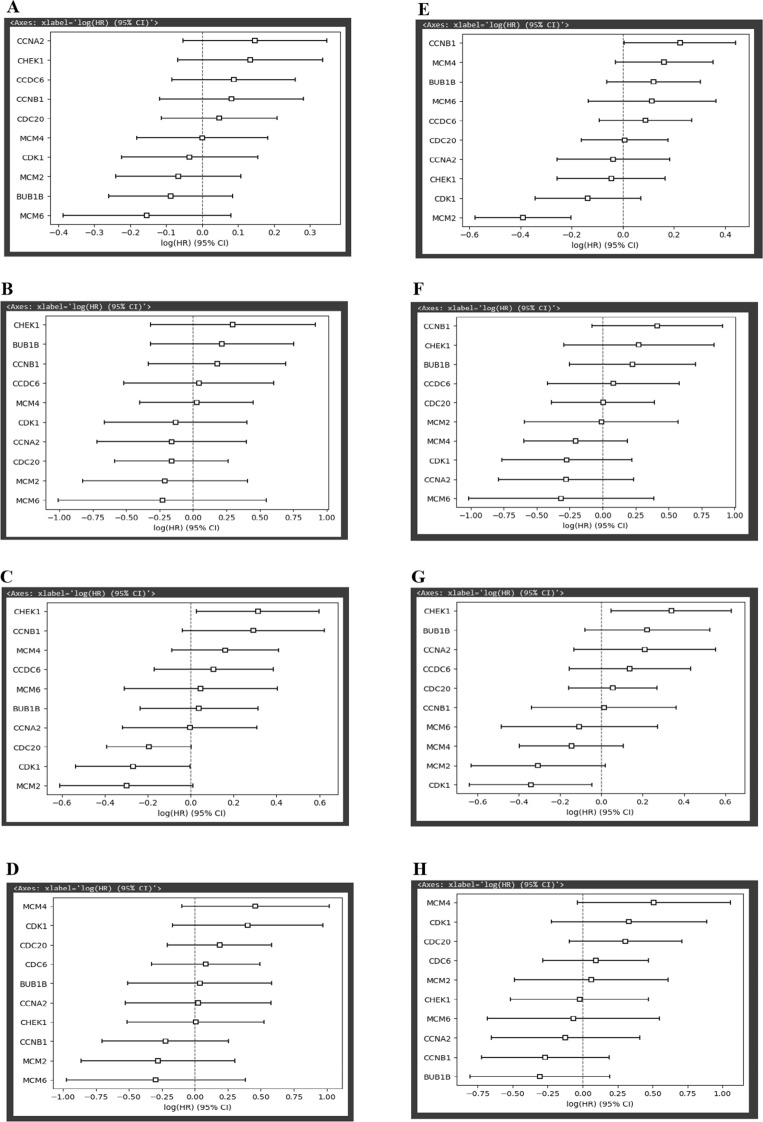
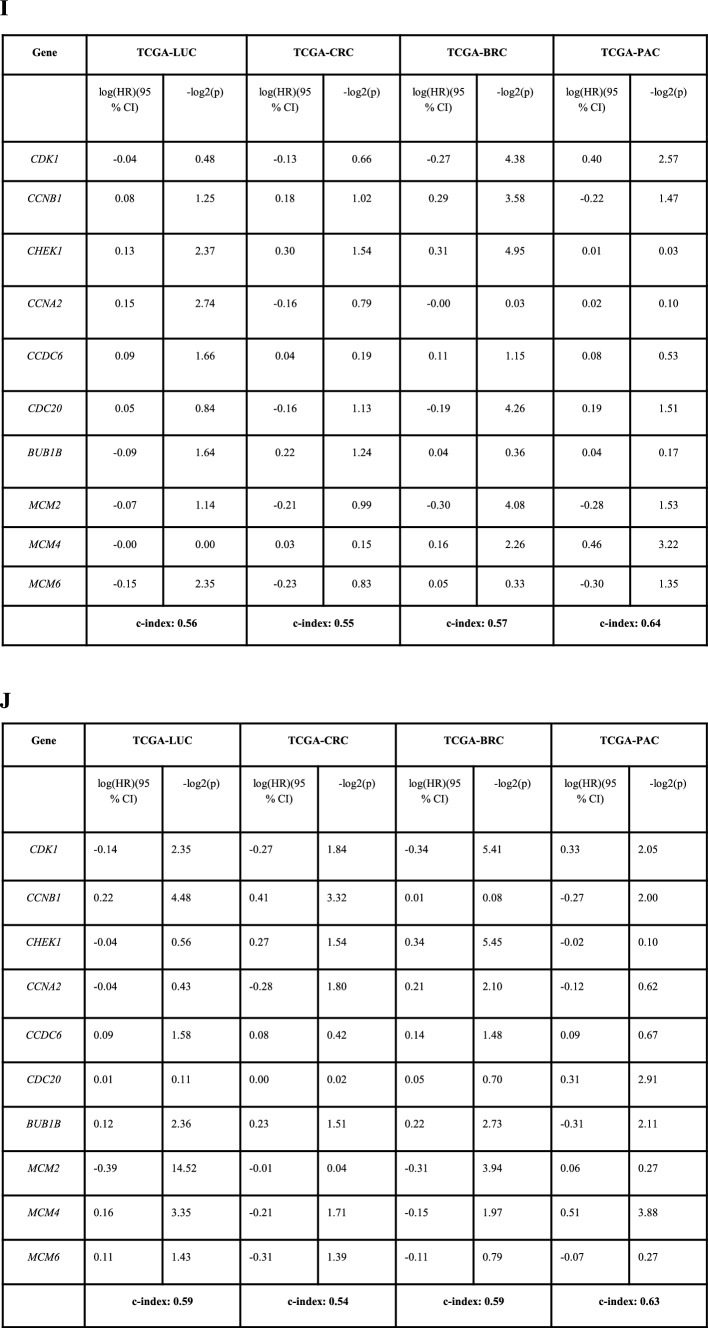
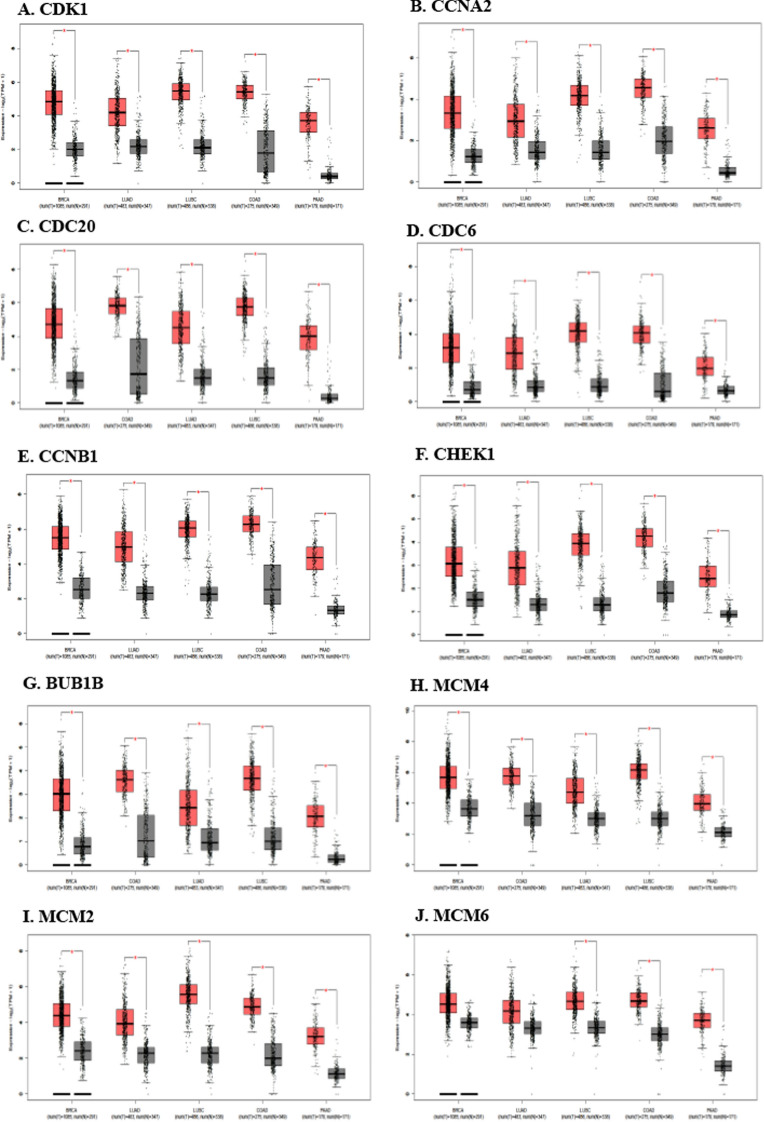
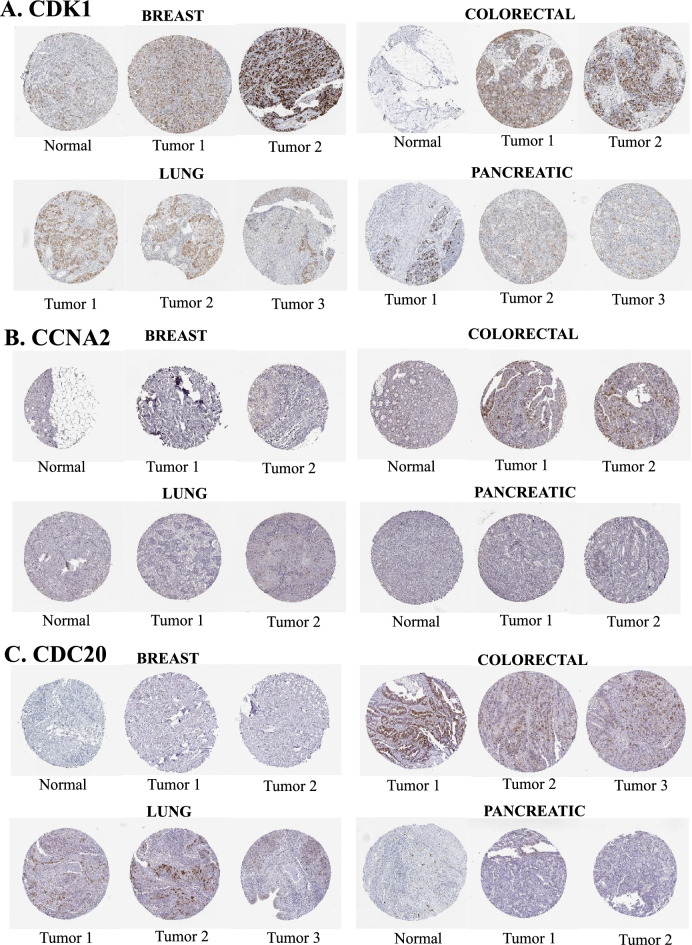
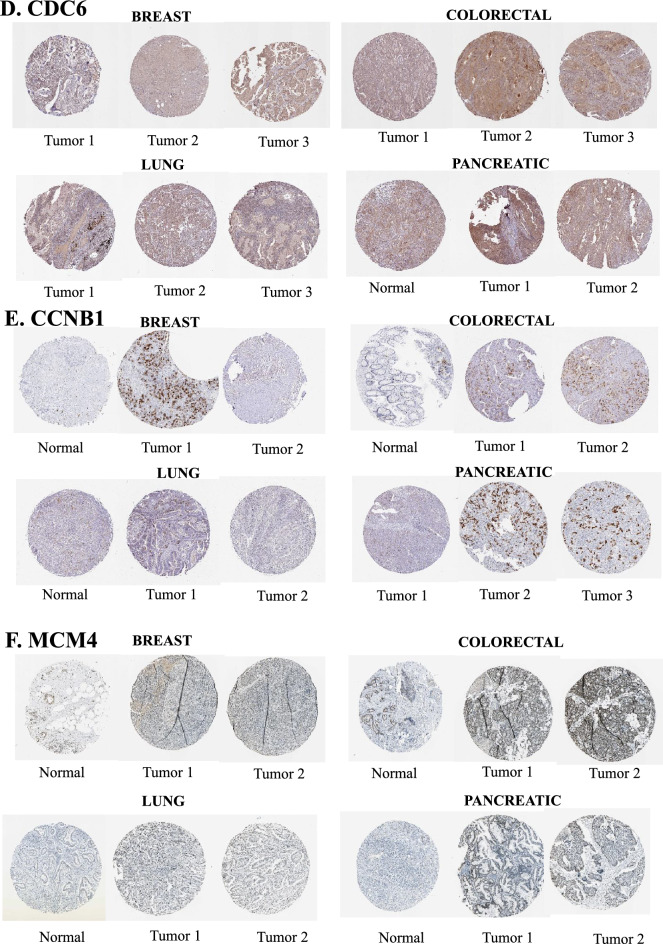
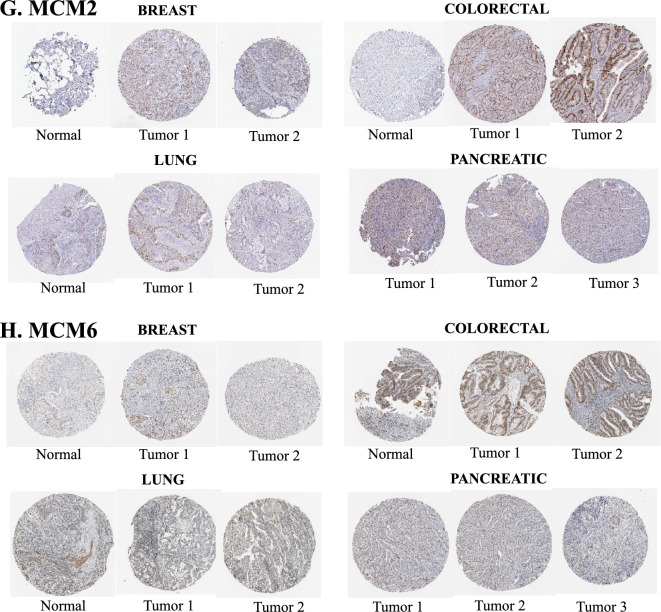
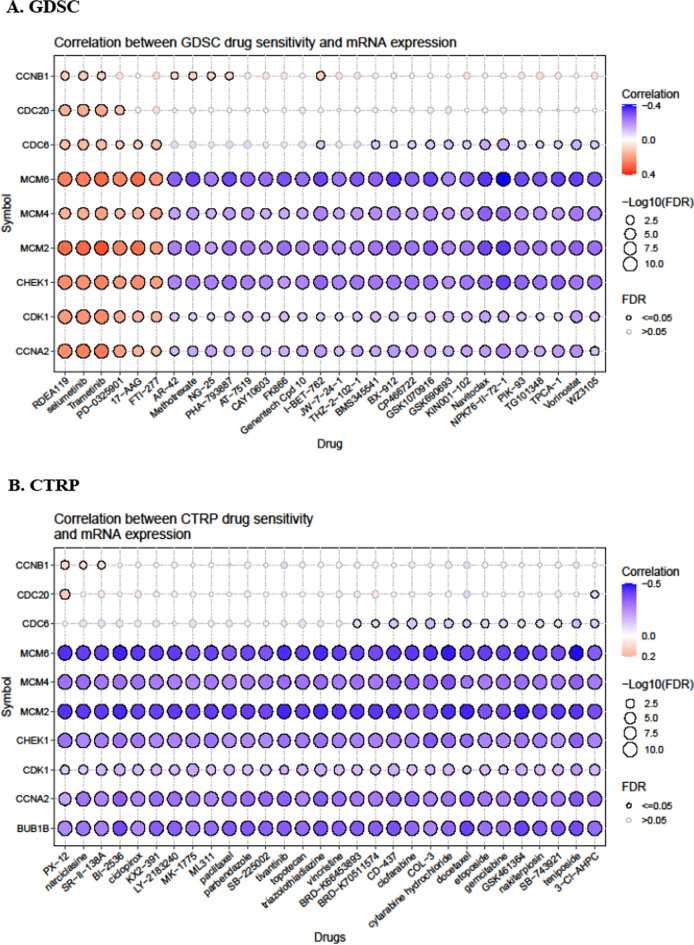
Cancer, a leading cause of death worldwide, is projected to increase by 76.6% in new cases and 89.7% in mortality by 2050 (WHO 2022). Among various types, lung cancer is the most prevalent with high morbidity, while breast, colorectal, and pancreatic cancers also show high mortality rates. Cancer progression often involves disruption in cell cycle regulation and signaling pathways, with mutations in genes like TP53, EGFR, and K-RAS playing significant roles. In this study, we analyzed gene expression datasets to identify common molecular signatures across breast, colorectal, lung and pancreatic cancers. Our focus was on genes related to cell cycle regulation and p53 signaling pathway, intending to discover potential biomarkers for improved diagnosis and treatment strategies. The study analyzed GEO datasets; GSE45827, GSE9348, GSE30219, and GSE62165 for breast, colorectal, lung, and pancreatic cancers respectively. Differentially expressed genes (DEGs) were identified using GEO2R, and functional annotation and pathway analysis were performed using WebGestalt. Common cell cycle and p53 signaling genes were acquired from MSigDB using GSEA. A protein-protein interaction network was constructed using STRING and Cytoscape, identifying top hub genes. Validation of hub genes at mRNA and protein levels was done via GEPIA2 and Human Protein Atlas. Survival analysis was conducted using TCGA data by GEPIA2 and LASSO, and drug sensitivity was analyzed with the GSCA drug bank database, highlighting potential therapeutic targets. The study identified 411 common DEGs among these four cancers. Pathway and functional enrichment revealed key biological processes and pathways like p53 signaling, and cell cycle. The intersection of these DEGs with genes involved in cell cycle and p53 signaling, identified 23 common genes that were used for constructing a PPI network. The top 10 hub genes were validated both for mRNA and protein expression, revealing they are significantly overexpressed in all studied cancers. Prognostic relevance showed that MCM4, MCM6, CCNA2, CDC20, and CHEK1 are associated with survival. Additionally, drug sensitivity analysis highlighted key gene-drug interactions, suggesting potential targets for therapeutic intervention.

Keywords: Breast cancer; Cell cycle; Colorectal cancer; Lung cancer; Pancreatic cancer; p53 signaling.


Conflict of interest statement

Declarations. Ethics approval and consent to participate: In this study, we utilized publicly available datasets. So ethical approval is not applicable. Consent for publication: Not applicable. Competing interests: The authors declare no competing interests.

Figures

Fig. 1
Fig. 1
The workflow of the present study is to identify hub signaling genes in BRC, CRC, LUC, and PAC as biomarkers. The common DEGs from all four cancer GSE datasets were followed by the KEGG pathway and GO. After genes were curated of enriched pathways intersected genes were identified with DEG to construct the PPI network to find the hub genes. After that, we checked the expression analysis at the transcript and protein level, survival analysis (KM Plot and LASSO), and drug sensitivity with hub genes
Fig. 2
Fig. 2
Identification of the common DEGs from BRC (GSE45827), CRC (GSE9348), LUC (GSE30219) and PAC (GSE62165) GEO data sets. (AD) Illustrates the volcano plots of DEGs among the studied cancers. BRC (A), CRC (B), LUC (C), and PAC (D) datasets respectively, are arranged along dimensions of biological as well as statistical significance. The red color showed upregulated, blue showed downregulated genes (adjusted p-value ≤ 0.05, and log2 FC (fold change) ≥ 1) and the black/brown color corresponds to non-significant genes with an adjusted p-value > 0.05. (E) Venn diagram was visualized in the Venny v2.1, showing common DEGs among BRC (GSE45827), CRC (GSE9348), LUC (GSE30219) and PAC (GSE62165) GEO data sets
Fig. 3
Fig. 3
Functional enrichment and pathways analysis of common DEGs. A-C Gene functional enrichment analysis of the 411 DEGs. The Top significant terms of GO, are gene functions, cellular components, biological processes showing on the x-axis and gene enrichment showing on the y-axis. A Biological process (BP) in red color, B cellular component (CC) in blue color and, C molecular function (MF) in green color. D KEGG pathway analysis of 411 DEGs. The top most significant enriched pathways of KEGG analysis. The enrichment ratio is shown on the x-axis and the expression of an enriched pathway is shown on the y-axis. E Volcano plots of the KEGG pathway analysis for 411 DEGs highlight the most significant enriched pathways
Fig. 4
Fig. 4
Identification of common signaling pathways genes between most enriched pathways and the 411 common DEGs. A Venn diagram of the common 411 DEGs (common in GSEs) and Cell cycle-related genes (genes from MSigDB) intersect. The 18 common genes are given by the intersection of 411 DEGs and Cell cycle-related genes in Venny v2.1. B Venn diagram of the common 411 DEGs (common in GSEs) and p53 signaling-related genes (genes from MSigDB) intersect. The 10 common genes are given by the intersection of 411 DEGs and p53 signaling-related genes in Venny v2.1. C Venn diagram of the common 411 DEGs (common in GSEs) and both signaling-related genes (genes from MSigDB) intersect. The 5 common genes are given by the intersection of 411 DEGs and both signaling related genes in Venny v2.1. D Venn diagram of the 411 DEGs (common in GSEs) and common signaling related genes (from MSigDB) intersect. The 23 common genes are given by the intersection of 411 DEGs and common in both signaling related (P53 and cell cycle) genes in Venny v2.1
Fig. 5
Fig. 5
Identification of hub genes from the identified 23 common signaling genes. A Protein–protein interaction (PPI) network of 23 common signaling genes showing the nodes and internodes. The PPI network is visvalized via STRING. B Visualized top 10 hub signaling genes identified by the PPI sub-network from Cytoscape v3.7.2: Cytohubba plugin software and their MCC topological metrics. The red colour represents the degree of connectivity., the deeper the red colour higher the degree of connectivity
Fig. 6
Fig. 6
KM plots curves for OS of 10 hub genes in high-risk and low-risk patients across all four cancers obtained from GEPIA2. The relationship between hub gene expression and OS prognosis of BRC, CRC, LUC, and PAC were obtained from TCGA. The survival period in months is indicated on the x-axis and the probability of survival is indicated on the y-axis. The median was chosen as the cut-off point to distinguish between cohorts with high and low expression. When gene expression increases and decreases, the red and blue blocks indicate greater and lower risks, respectively. AJ KM plots for OS and gene expression rates of 10 hub signaling genes in TCGA data on the GEPIA2 database combined all four cancers. (A) CDK1, (B) CCNA2, (C) CDC20, (D) CDC6, (E) CCNB1, (F) CHEK1, (G) BUB1B, (H) MCM6, (I) MCM2, and (J) MCM4
Fig. 7
Fig. 7
The OS and DFS analysis of 10 hub genes by the Cox proportional hazard model with LASSO using TCGA data cohort; BRC, CRC, LUC and PAC. The sklearn package and scikit-survival were used to compute the measure of OS and DFS efficacy of the discovered hub genes. The log (HR) (95% CI) and the -log2 (p) value of each gene for each cohort, along with the resultant concordance index (c-index) are shown. The resultant c-index indicates that the discovered hub genes are significant enough to predict survival with higher accuracy. A-D The OS prediction of the model utilizing the hub genes. In the boxplot, x-axis shows the log (HR) (95% CI) and the y-axis shows the hub genes. (A) TCGA-LUC, (B) TCGA-CRC, (C) TCGA-BRC, and (D) TCGA-PAC. E–H The DFS prediction of the model utilizing the hub genes. In the boxplot, x-axis shows the log (HR) (95% CI) and the y-axis shows the hub genes. (E) TCGA-LUC, (F) TCGA-CRC, (G) TCGA-BRC, and (H) TCGA-PAC. I and J The sklearn package lifelines and scikit-survival were used to compute the measure of OS and DFS efficacy of the discovered hub genes via the Cox proportional hazard model with LASSO. The log (HR) (95% CI) and the -log2(p) value of each gene for each data cohort (BRC, CRC, LUC, and PAC), along with the resultant concordance index (c-index) are shown in the figures. The computation of the (I) OS and (J) DFS efficacy of the discovered hub genes. The concordance index (c-index) of the hub genes is ~ 0.6 for all the data cohorts, exhibiting their appropriate efficacy in the prediction of survival
Fig. 7
Fig. 7
The OS and DFS analysis of 10 hub genes by the Cox proportional hazard model with LASSO using TCGA data cohort; BRC, CRC, LUC and PAC. The sklearn package and scikit-survival were used to compute the measure of OS and DFS efficacy of the discovered hub genes. The log (HR) (95% CI) and the -log2 (p) value of each gene for each cohort, along with the resultant concordance index (c-index) are shown. The resultant c-index indicates that the discovered hub genes are significant enough to predict survival with higher accuracy. A-D The OS prediction of the model utilizing the hub genes. In the boxplot, x-axis shows the log (HR) (95% CI) and the y-axis shows the hub genes. (A) TCGA-LUC, (B) TCGA-CRC, (C) TCGA-BRC, and (D) TCGA-PAC. E–H The DFS prediction of the model utilizing the hub genes. In the boxplot, x-axis shows the log (HR) (95% CI) and the y-axis shows the hub genes. (E) TCGA-LUC, (F) TCGA-CRC, (G) TCGA-BRC, and (H) TCGA-PAC. I and J The sklearn package lifelines and scikit-survival were used to compute the measure of OS and DFS efficacy of the discovered hub genes via the Cox proportional hazard model with LASSO. The log (HR) (95% CI) and the -log2(p) value of each gene for each data cohort (BRC, CRC, LUC, and PAC), along with the resultant concordance index (c-index) are shown in the figures. The computation of the (I) OS and (J) DFS efficacy of the discovered hub genes. The concordance index (c-index) of the hub genes is ~ 0.6 for all the data cohorts, exhibiting their appropriate efficacy in the prediction of survival
Fig. 8
Fig. 8
Validation of hub signaling genes at mRNA level:—The box plot showing the comparative expression level Transcript per million (TPM) of hub signaling genes in the TGCA cohort between cancer v/s normal patients of BRC, CRC, LUC, and PAC from the GEPIA2 database. To execute differential expression of the input hub genes, GEPIA2 employs one-way ANOVA and uses the diseased stage on the x-axis as the variable. Analysis was conducted using log2(TPM + 1) on the y-axis transformed expression data. The red and grey boxes represent cancer and normal tissues, respectively. The total number of samples used from TCGA for the analysis are; Breast Cancer (BRCA: T = 1085, N = 291), Colon Adenocarcinoma (COAD: T = 275, N = 349), Lungs Adenocarcinoma (LUAD: T-483, N = 347), Lungs Squamous cell carcinoma (LUSC: T = 486, N = 338), and Pancreatic adenocarcinoma (PAAD: T-179, N-171) patients. p-value for the significance *, P ≤ 0.05; **, P ≤ 0.01; ****, P ≤ 0.0001. A-J Box plots showing the expression level of hub genes. (A) CDK1, (B) CCNA2, (C) CDC20, (D) CDC6, (E) CCNB1, (F) CHEK1, (G) BUB1B, (H) MCM4, (I) MCM2, and (J) MCM6
Fig. 9
Fig. 9
Validation of hub signaling genes expression at the protein level: The immunohistochemistry showing the expression level of the protein of hub signaling genes fromHPA between cancer v/s normal patients’ tissue samples of BRC, CRC, LUC, and PAC. The immunohistochemistry results are shown in order of breast, colorectal, lung and pancreatic respectively. A–H The immunohistochemistry shows the expression level of the protein of hub genes. (A) CDK1, (B) CCNA2, (C) CDC20, (D) CDC6, (E) CCNB1, (F) MCM4, (G) MCM2, and (H) MCM6
Fig. 9
Fig. 9
Validation of hub signaling genes expression at the protein level: The immunohistochemistry showing the expression level of the protein of hub signaling genes fromHPA between cancer v/s normal patients’ tissue samples of BRC, CRC, LUC, and PAC. The immunohistochemistry results are shown in order of breast, colorectal, lung and pancreatic respectively. A–H The immunohistochemistry shows the expression level of the protein of hub genes. (A) CDK1, (B) CCNA2, (C) CDC20, (D) CDC6, (E) CCNB1, (F) MCM4, (G) MCM2, and (H) MCM6
Fig. 10
Fig. 10
Drug sensitivity of the 10 hub genes from the GSCA. GSCA comprises the mRNA expression and drug sensitivity from GDSC databank and CTRP data bank. In both the drug data bank, a positive correlation (red color) indicates a higher gene expression may lead to drug resistance. A negative correlation (blue color) indicates a higher gene expression may lead to drug sensitivity. A Top 30 drug sensitivity analysis in GDSC databank. A Top 30 drug sensitivity analysis in CTRP databank

Similar articles

References

    1. Phillips JL, Currow DC. Cancer as a chronic disease. Collegian. 2010;17:47–50. - PubMed
    1. Bray F, Laversanne M, Weiderpass E, Soerjomataram I. The ever-increasing importance of cancer as a leading cause of premature death worldwide. Cancer. 2021;127:3029–30. - PubMed
    1. Cancer. https://www.who.int/health-topics/cancer.
    1. World Cancer Day 2024: Close the care gap - PAHO/WHO | Pan American Health Organization. https://www.paho.org/en/campaigns/world-cancer-day-2024-close-care-gap.
    1. Bray F, et al. Global cancer statistics 2022: GLOBOCAN estimates of incidence and mortality worldwide for 36 cancers in 185 countries. CA Cancer J Clin. 2024;74:229–63. - PubMed

LinkOut - more resources