. 2024 Dec 23;14(1):30588.
doi: 10.1038/s41598-024-81593-7.

A finite source retrial queueing inventory system with stock dependent arrival and heterogeneous servers

Affiliations

A finite source retrial queueing inventory system with stock dependent arrival and heterogeneous servers

T Harikrishnan et al. Sci Rep. .

Abstract

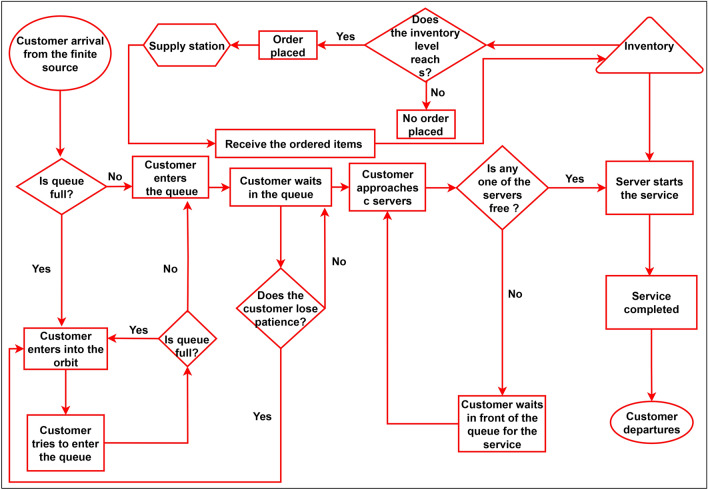
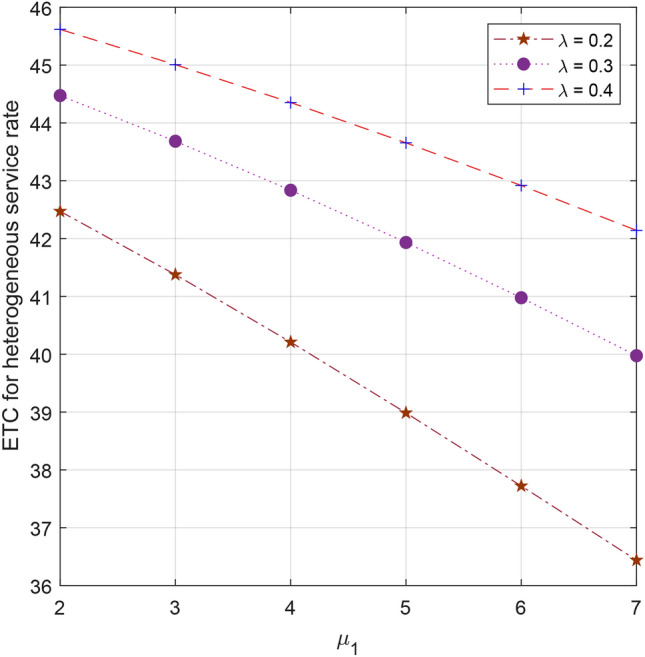
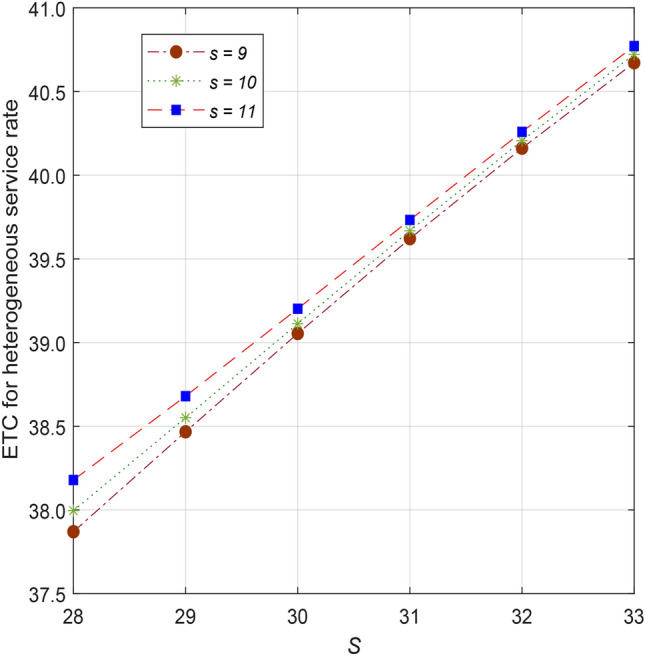
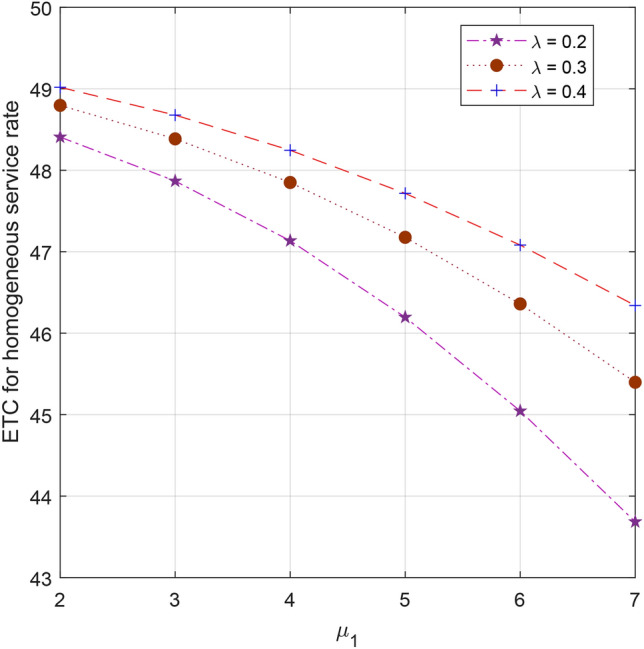
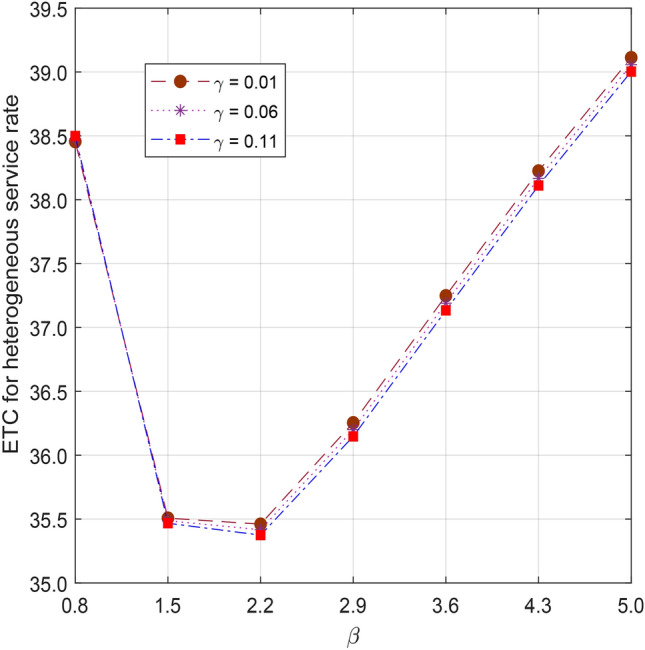
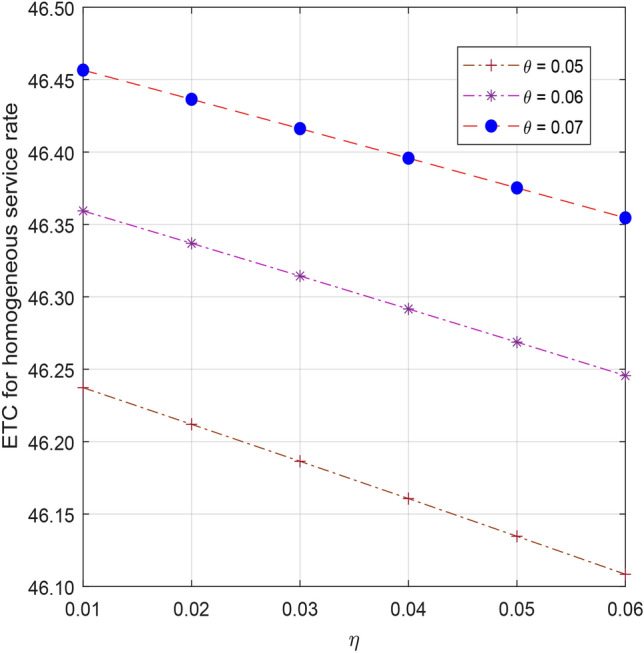
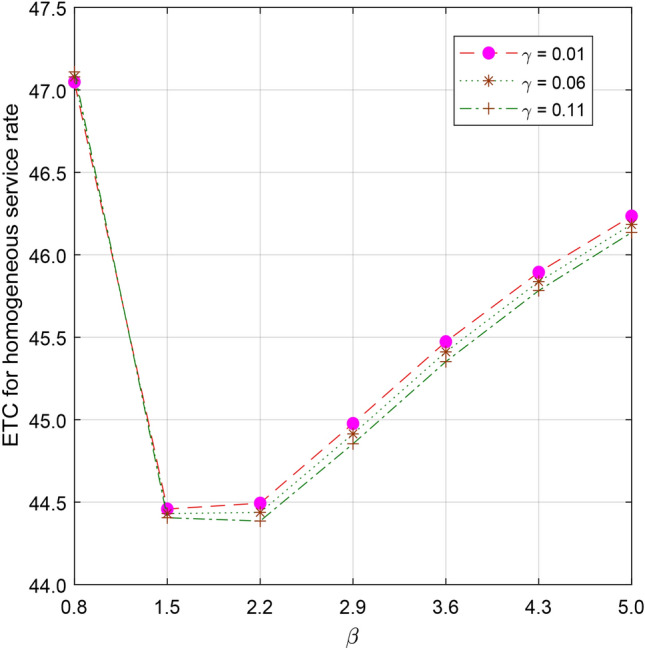
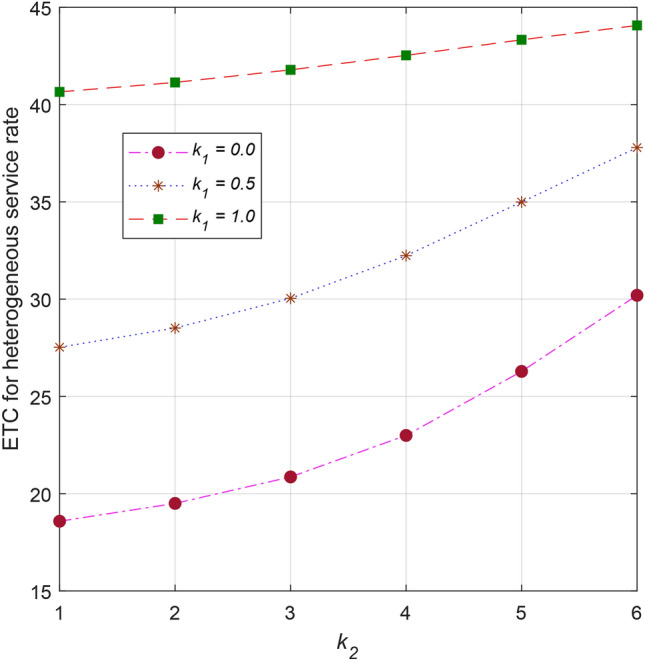
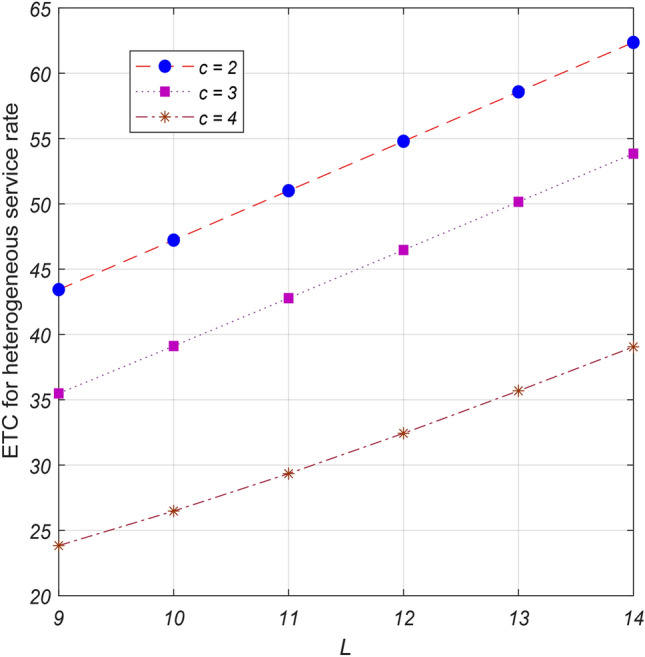
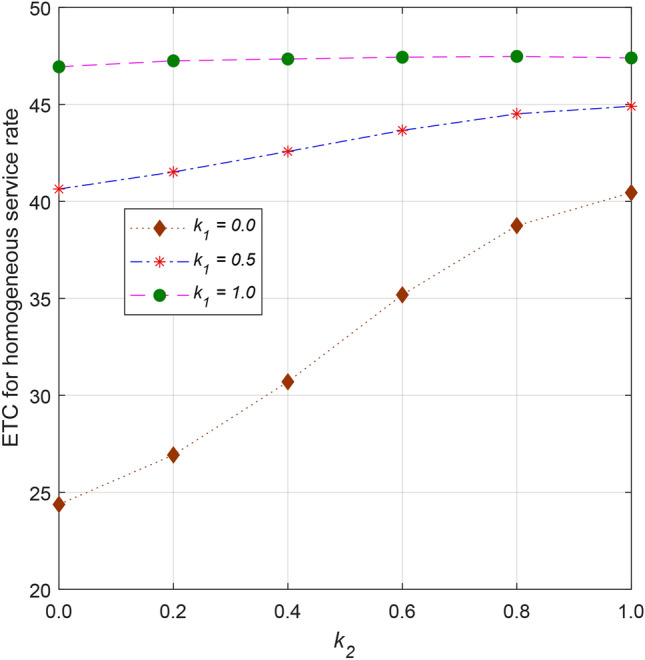
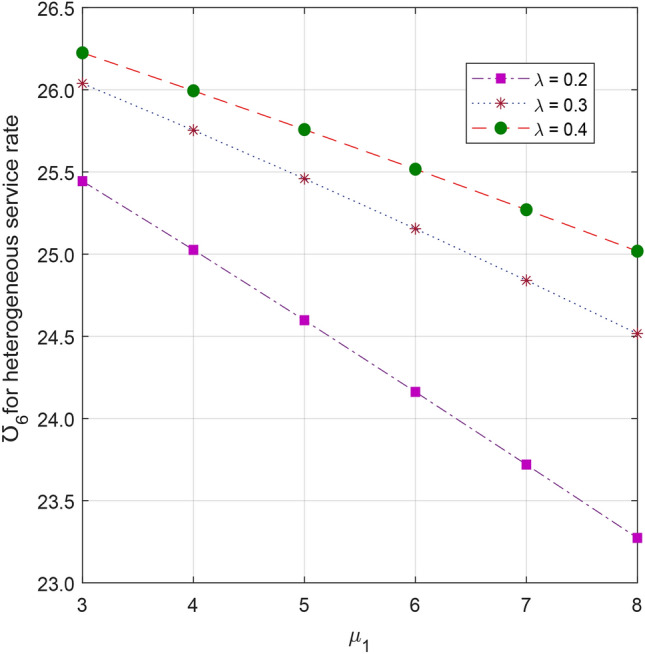
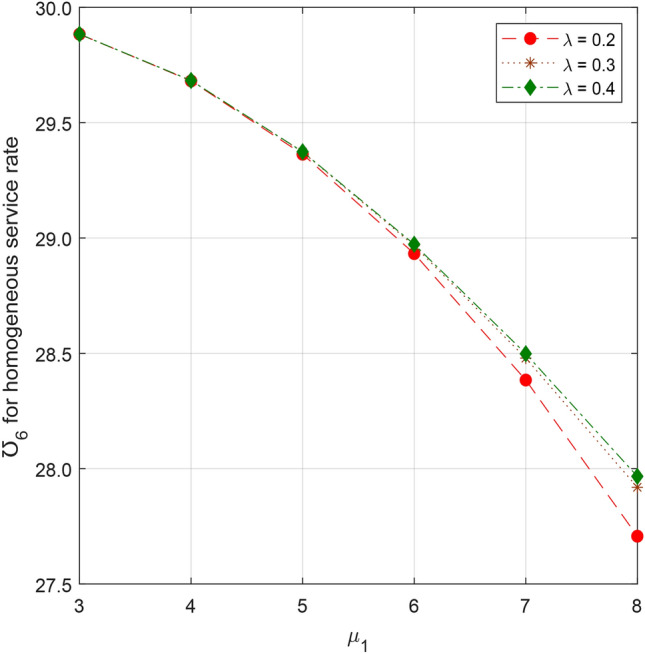
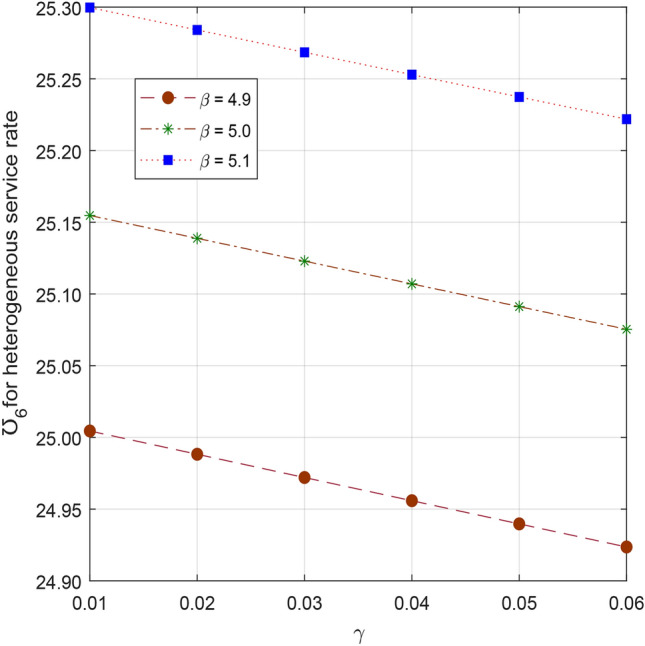
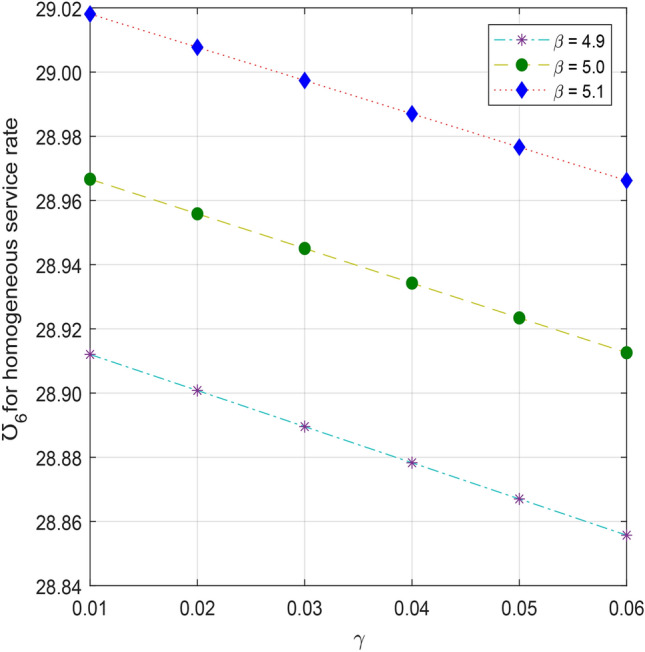
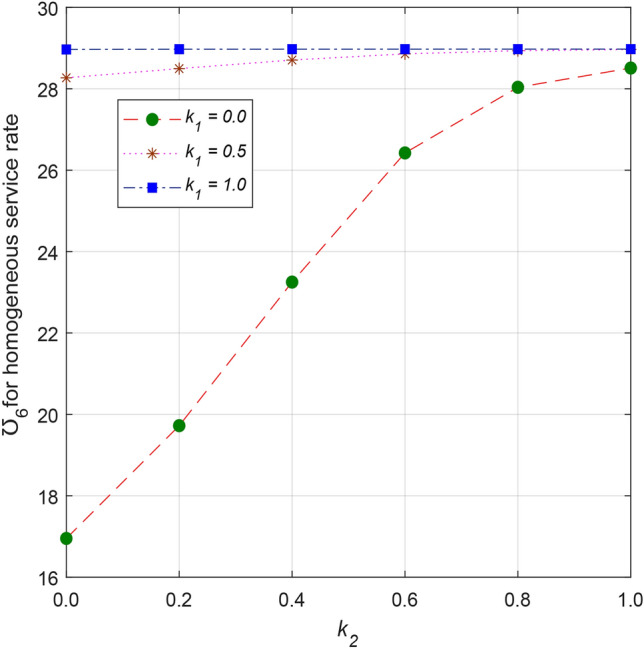
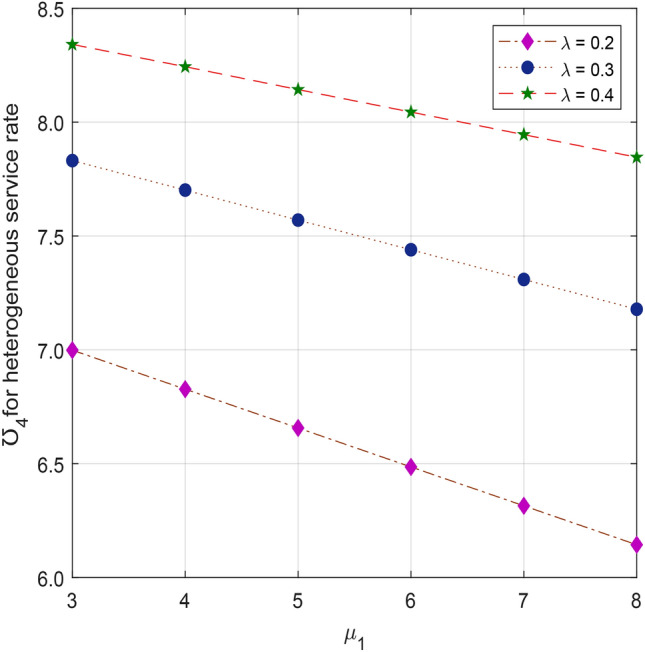
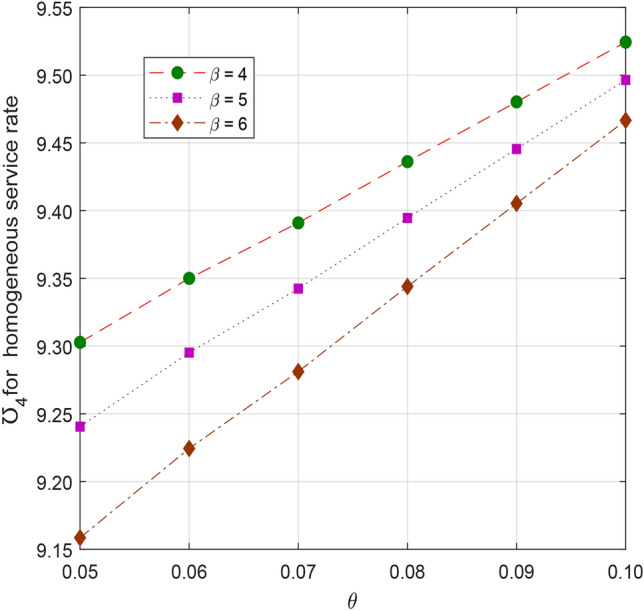
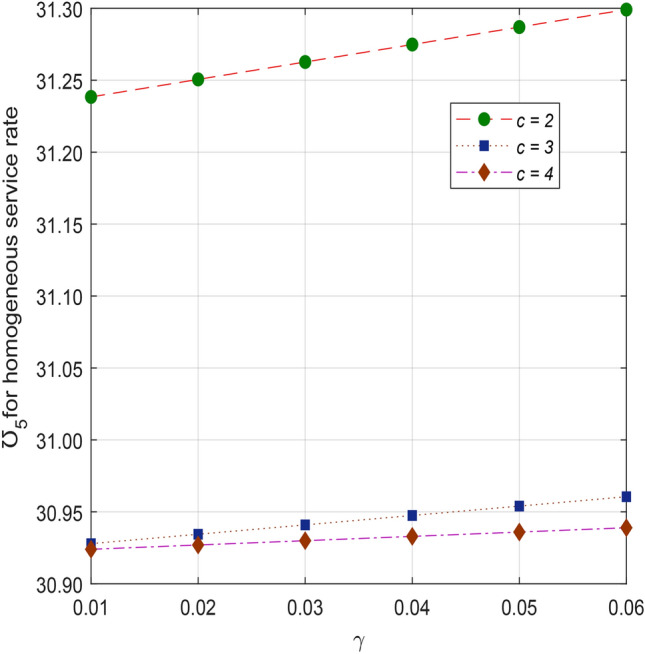
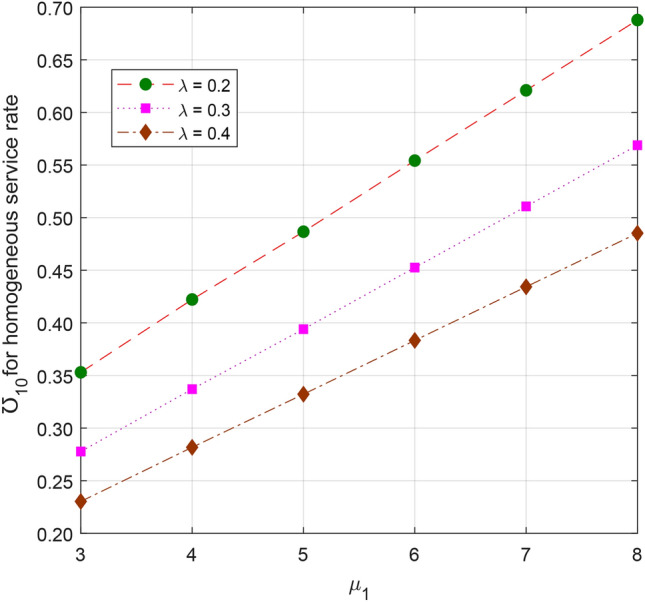
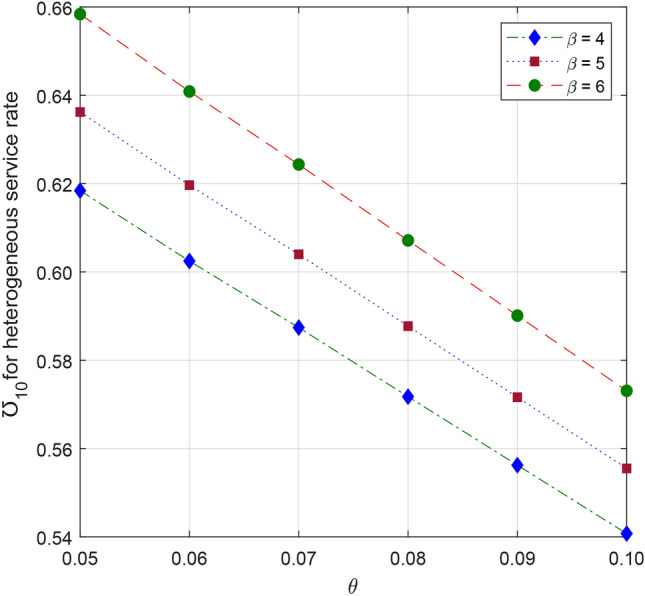
This article discusses a finite-source stock-dependent stochastic inventory system with multiple servers and a retrial facility. The system can store a maximum of S items, and the lifetime of each item is exponentially distributed. The primary customer arrives at the waiting hall from the finite source and receives service from multi-servers. The rate at which customers arrive depends on the current stock level. If the waiting hall is full during the primary customer's arrival, he enters the finite orbit. Additionally, customers in the waiting hall may lose patience and enter the orbit. To replenish the stock, we follow the (s, Q) ordering policy. We calculate the joint probability distribution of the number of inventory items, busy servers, and number of customers in the waiting hall and orbit at a steady state. We conduct a comparative numerical analysis to determine the impact of heterogeneous and homogeneous service rates on various metrics, such as the average impatient customer rate, the fraction of successful retrials, and the average number of customers in the waiting hall and orbit.

Keywords: (s, Q) ordering policy; Classical retrial policy; Impatient customers; Markov chain; Multi-server; Steady-state; Stock-dependent arrival.


Conflict of interest statement

Declarations. Competing interests: The authors declare no competing interests.

Figures

Fig. 1
Fig. 1
Flow chart of the model.
Fig. 2
Fig. 2
ETC for heterogeneous service rate: formula image vs formula image.
Fig. 3
Fig. 3
ETC for heterogeneous service rate: S vs s.
Fig. 4
Fig. 4
ETC for homogeneous service rate: formula image vs formula image.
Fig. 5
Fig. 5
ETC for homogeneous service rate: S vs s.
Fig. 6
Fig. 6
ETC for heterogeneous service rate: formula image vs formula image.
Fig. 7
Fig. 7
ETC for heterogeneous service rate: formula image vs formula image.
Fig. 8
Fig. 8
ETC for homogeneous service rate: formula image vs formula image.
Fig. 9
Fig. 9
ETC for homogeneous service rate: formula image vs formula image.
Fig. 10
Fig. 10
ETC for heterogeneous service rate: formula image vs formula image.
Fig. 11
Fig. 11
ETC for heterogeneous service rate: c vs L.
Fig. 12
Fig. 12
ETC for homogeneous service rate: formula image vs formula image.
Fig. 13
Fig. 13
ETC for homogeneous service rate: c vs L.
Fig. 14
Fig. 14
Average number of heterogeneous busy servers: formula image vs formula image.
Fig. 15
Fig. 15
Average number of homogeneous busy servers: formula image vs formula image.
Fig. 16
Fig. 16
Average number of heterogeneous busy servers: S vs s.
Fig. 17
Fig. 17
Average number of heterogeneous busy servers: formula image vs formula image.
Fig. 18
Fig. 18
Average number of homogeneous busy servers: S vs s.
Fig. 19
Fig. 19
Average number of homogeneous busy servers: formula image vs formula image.
Fig. 20
Fig. 20
Average number of heterogeneous busy servers: formula image vs formula image.
Fig. 21
Fig. 21
Average number of heterogeneous busy servers: formula image vs formula image.
Fig. 22
Fig. 22
Average number of homogeneous busy servers: formula image vs formula image.
Fig. 23
Fig. 23
Average number of homogeneous busy servers: formula image vs formula image.
Fig. 24
Fig. 24
Average number of heterogeneous busy servers: c vs L.
Fig. 25
Fig. 25
Average number of homogeneous busy servers: c vs L.
Figure 26
Figure 26
Average number of customers in the waiting hall for heterogeneous service rate: formula image vs formula image.
Fig. 27
Fig. 27
Average number of customers in the waiting hall for homogeneous service rate: formula image vs formula image.
Fig. 28
Fig. 28
Average number of customers in the waiting hall for heterogeneous service rate: c vs formula image.
Fig. 29
Fig. 29
Average number of customers in the waiting hall for homogeneous service rate: c vs formula image.
Fig. 30
Fig. 30
Average number of customers in the waiting hall for heterogeneous service rate: formula image vs formula image.
Fig. 31
Fig. 31
Average number of customers in the waiting hall for homogeneous service rate: formula image vs formula image.
Fig. 32
Fig. 32
Average number of customers in the orbit for heterogeneous service rate: formula image vs formula image.
Fig. 33
Fig. 33
Average number of customers in the orbit for heterogeneous service rate: c vs formula image.
Fig. 34
Fig. 34
Average number of customers in the orbit for homogeneous service rate: formula image vs formula image.
Fig. 35
Fig. 35
Average number of customers in the orbit for homogeneous service rate: c vs formula image.
Fig. 36
Fig. 36
Average number of customers in the orbit for heterogeneous service rate: formula image vs formula image.
Fig. 37
Fig. 37
Average number of customers in the orbit for homogeneous service rate: formula image vs formula image.
Fig. 38
Fig. 38
Fraction of successful rate of retrial for heterogeneous service rate: formula image vs formula image.
Fig. 39
Fig. 39
Fraction of successful rate of retrial for homogeneous service rate: formula image vs formula image.
Fig. 40
Fig. 40
Fraction of successful rate of retrial for heterogeneous service rate: formula image vs formula image.
Fig. 41
Fig. 41
Fraction of successful rate of retrial for homogeneous service rate: formula image vs formula image.
Fig. 42
Fig. 42
Fraction of successful rate of retrial for heterogeneous service rate: c vs formula image.
Fig. 43
Fig. 43
Fraction of successful rate of retrial for homogeneous service rate: c vs formula image.

References

    1. Ke, J. C. & Wang, K. H. Cost analysis of the M/M/R machine repair problem with balking, reneging, and server breakdowns. Journal of the Operational Research Society50, 275–282 (1999).
    1. Stecke, K. E. Machine interference: Assignment of machines to operators. Handbook of Industrial Engineering, 14601494 (1992).
    1. Sztrik, J. Finite-source queueing systems and their applications. Formal Methods in Computing1, 7–10 (2001).
    1. Iravani, S. M., Krishnamurthy, V. & Chao, G. H. Optimal server scheduling in nonpreemptive finite-population queueing systems. Queueing Systems55, 95–105 (2007).
    1. Delasay, M., Kolfal, B. & Ingolfsson, A. Maximizing throughput in finite-source parallel queue systems. European Journal of Operational Research217, 554–559 (2012).

LinkOut - more resources