. 2025 Feb;9(2):391-405.
doi: 10.1038/s41562-024-02076-3. Epub 2024 Dec 23.

Polygenic prediction of occupational status GWAS elucidates genetic and environmental interplay in intergenerational transmission, careers and health in UK Biobank

Affiliations

Polygenic prediction of occupational status GWAS elucidates genetic and environmental interplay in intergenerational transmission, careers and health in UK Biobank

Evelina T Akimova et al. Nat Hum Behav. 2025 Feb.

Abstract

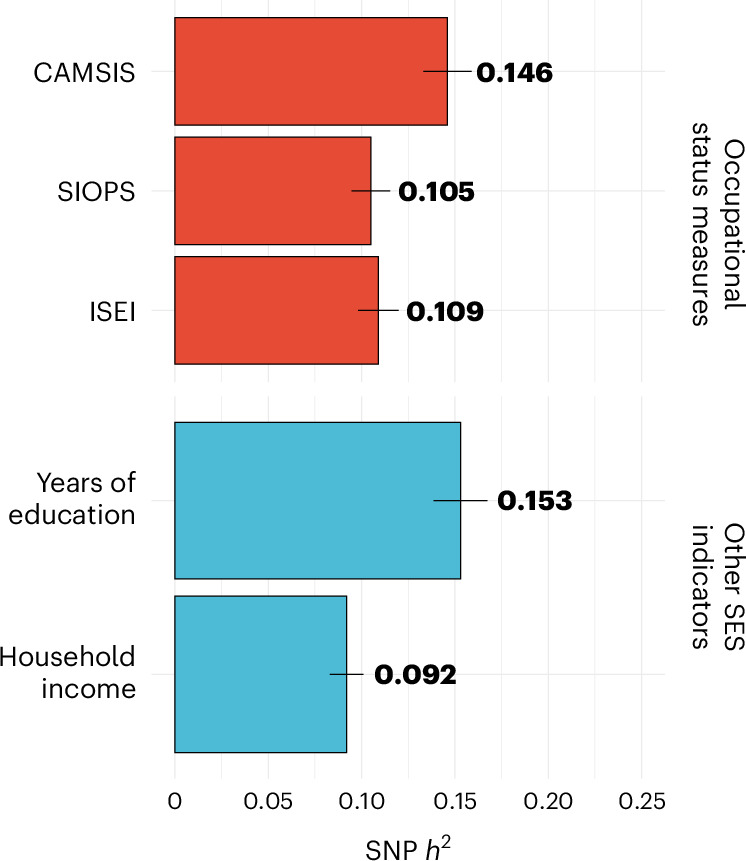
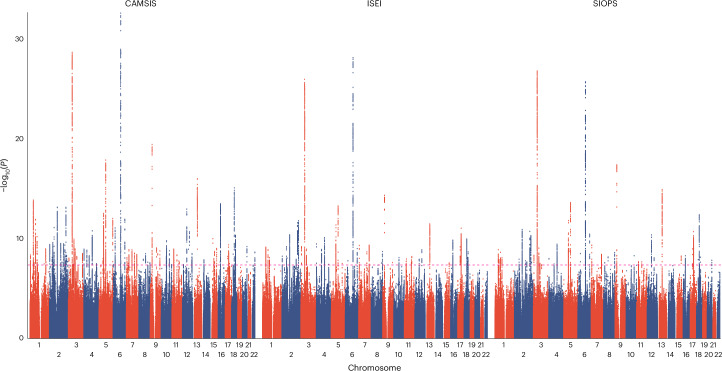
Socioeconomic status (SES) impacts health and life-course outcomes. This genome-wide association study (GWAS) of sociologically informed occupational status measures (ISEI, SIOPS, CAMSIS) using the UK Biobank (N = 273,157) identified 106 independent single-nucleotide polymorphisms of which 8 are novel to the study of SES. Genetic correlations with educational attainment (rg = 0.96-0.97) and income (rg = 0.81-0.91) point to a common genetic factor for SES. We observed a 54-57% reduction in within-family predictions compared with population-based predictions, attributed to indirect parental effects (22-27% attenuation) and assortative mating (21-27%) following our calculations. Using polygenic scores from population predictions of 5-10% (incremental R2 = 0.023-0.097 across different approaches and occupational status measures), we showed that (1) cognitive and non-cognitive traits, including scholastic and occupational motivation and aspiration, link polygenic scores to occupational status and (2) 62% of the intergenerational transmission of occupational status cannot be ascribed to genetic inheritance of common variants but other factors such as family environments. Finally, links between genetics, occupation, career trajectory and health are interrelated with parental occupational status.


Conflict of interest statement

Competing interests: M.C.M. is a Trustee of the UK Biobank, is on the Scientific Advisory Board of Our Future Health and Lifelines Biobank and is on the Data Management Advisory Board of the Health and Retirement Survey. The remaining authors declare no competing interests. F.C.T. is a research fellow at AnalytiXIN, which is a consortium of health-data organizations, industry partners and university partners in Indiana primarily funded through the Lilly Endowment, IU Health and Eli Lilly and Company.

Figures

Fig. 1
Fig. 1. Comparison of SNP-heritability estimates of occupational status measures vs income and education.
LD score-based SNP-heritability estimates of occupational status measures CAMSIS (N = 273,157), SIOPS (N = 271,769) and ISEI (N = 271,769) compared to income (N = 353,673) and education (N = 404,420). Each bar is a single estimate of SNP heritability and each error bar indicates the s.e. of the estimate (95% confidence intervals (CIs) are presented). Source data
Fig. 2
Fig. 2. Manhattan plot of the GWASs for occupational status measures.
Manhattan plot with autosomal SNP position on the x axis and the logarithm of the P value on the y axis of the GWASs for occupational status measures CAMSIS (N = 273,157), ISEI (N = 271,769) and SIOPS (N = 271,769).
Fig. 3
Fig. 3. Phenotypic and genetic correlations of occupational status measures and other SES indicators.
Upper triangle: phenotypic correlations. Lower triangle: genetic correlations. Correlations of occupational status measures and other SES indicators are based on LD score regression. N = 246,492 for phenotypic correlations. Darker blue circles indicate stronger positive correlations.
Fig. 4
Fig. 4. Out-of-sample polygenic prediction performance within UK Biobank and NCDS.
Incremental R2 compared to a baseline model consisting of 10 principal components, sex and age. Bars denote 95% CIs. N = 24,579 for CAMSIS and 24,472 for ISEI and SIOPS in the UK Biobank; for NCDS average performance over different ages, N = 5,389; 5,312; 5,211; 4,902; and 4,263 for CAMSIS at ages 33, 42, 46, 50 and 55; and corresponding N = 5,449; 5,293; 5,197; 4,892; and 4,252 for ISEI/SIOPS. Source data
Fig. 5
Fig. 5. Mean percentile of the CAMSIS occupational status distribution across career stratified by sex, parental education and the CAMSIS PGS.
N = 201,939 time points from 5,475 individuals. Parental education measured as Low = no qualifications, Medium = lower secondary and High = upper secondary/degree. Bars denote 95% CIs.
Fig. 6
Fig. 6. Ratio of standardized beta coefficients for the effect of the respective PGS on the phenotype based on within-sibship, adoption and parental control models to the population estimate for CAMSIS, SIOPS and ISEI.
Ratios based on within-sibship, adoption and parental-control models. N = 24,579 for CAMSIS, 24,472 for ISEI and SIOPS (within-sibship); N = 3,398 for CAMSIS and 3,414 for ISEI and SIOPS (adoption); N = 13,972 for CAMSIS and 13,973 for ISEI and SIOPS (parental control). Each estimate is the ratio of standardized beta coefficient of within-sibship, adoption or parental-control model PGS, βreduced, to the beta coefficient of population-based PGS, βPGS. The error bars represent 95% CIs calculated with the bootstrap method (1,000 repetitions).
Fig. 7
Fig. 7. Mediation model results of polygenic prediction of occupational status in NCDS through the life course.
N = 3,169; 3,111; 3,075; 2,881; and 2,499 for CAMSIS at ages 33, 42, 46, 50 and 55; and corresponding N = 3,196; 3,100; 3,068; 2,878; and 2,494 for SIOPS and ISEI. Separate linear regression models with two-sided tests. Stars indicate the significance level based on P values: no star, P > 0.05; *0.01 ≤ P < 0.05; **0.001 ≤ P < 0.01; ***P < 0.001.
Fig. 8
Fig. 8. Percentage of genetic confounding in the intergenerational transmission of occupational status in NCDS through the life course.
Percentages based on the predictive validity of polygenic scores (GWAS heritability) and an extrapolation of their effect to the variance explained by common SNPs (SNP heritability). N = 3,875; 3,835; 3,747; 3,550; and 3,079 for CAMSIS at ages 33, 42, 46, 50 and 55; and corresponding N = 3,902; 3,797; 3,718; 3,522; and 3,053 for SIOPS/ISEI.
Extended Data Fig. 1
Study Summary Diagram.

References

    1. Lambert, P. & Griffiths, D. Social Inequalities and Occupational Stratification: Methods and Concepts in the Analysis of Social Distance (Springer, 2018).
    1. Marmot, M. The health gap: the challenge of an unequal world: the argument. Int. J. Epidemiol.46, 1312–1318 (2017). - PMC - PubMed
    1. Mills, M., Rindfuss, R. R., McDonald, P. & te Velde, E. Why do people postpone parenthood? Reasons and social policy incentives. Hum. Reprod. Update17, 848–860 (2011). - PMC - PubMed
    1. Clark, G. The Son Also Rises (Princeton Univ. Press, 2014).
    1. Breen, R. & Jonsson, J. O. Inequality of opportunity in comparative perspective: recent research on educational attainment and social mobility. Annu. Rev. Socio.31, 223–243 (2005).

LinkOut - more resources