. 2024 Dec;8(12):1592-1614.
doi: 10.1038/s41551-024-01287-3. Epub 2024 Dec 23.

Leucine zipper-based immunomagnetic purification of CAR T cells displaying multiple receptors

Affiliations

Leucine zipper-based immunomagnetic purification of CAR T cells displaying multiple receptors

Scott E James et al. Nat Biomed Eng. 2024 Dec.

Abstract

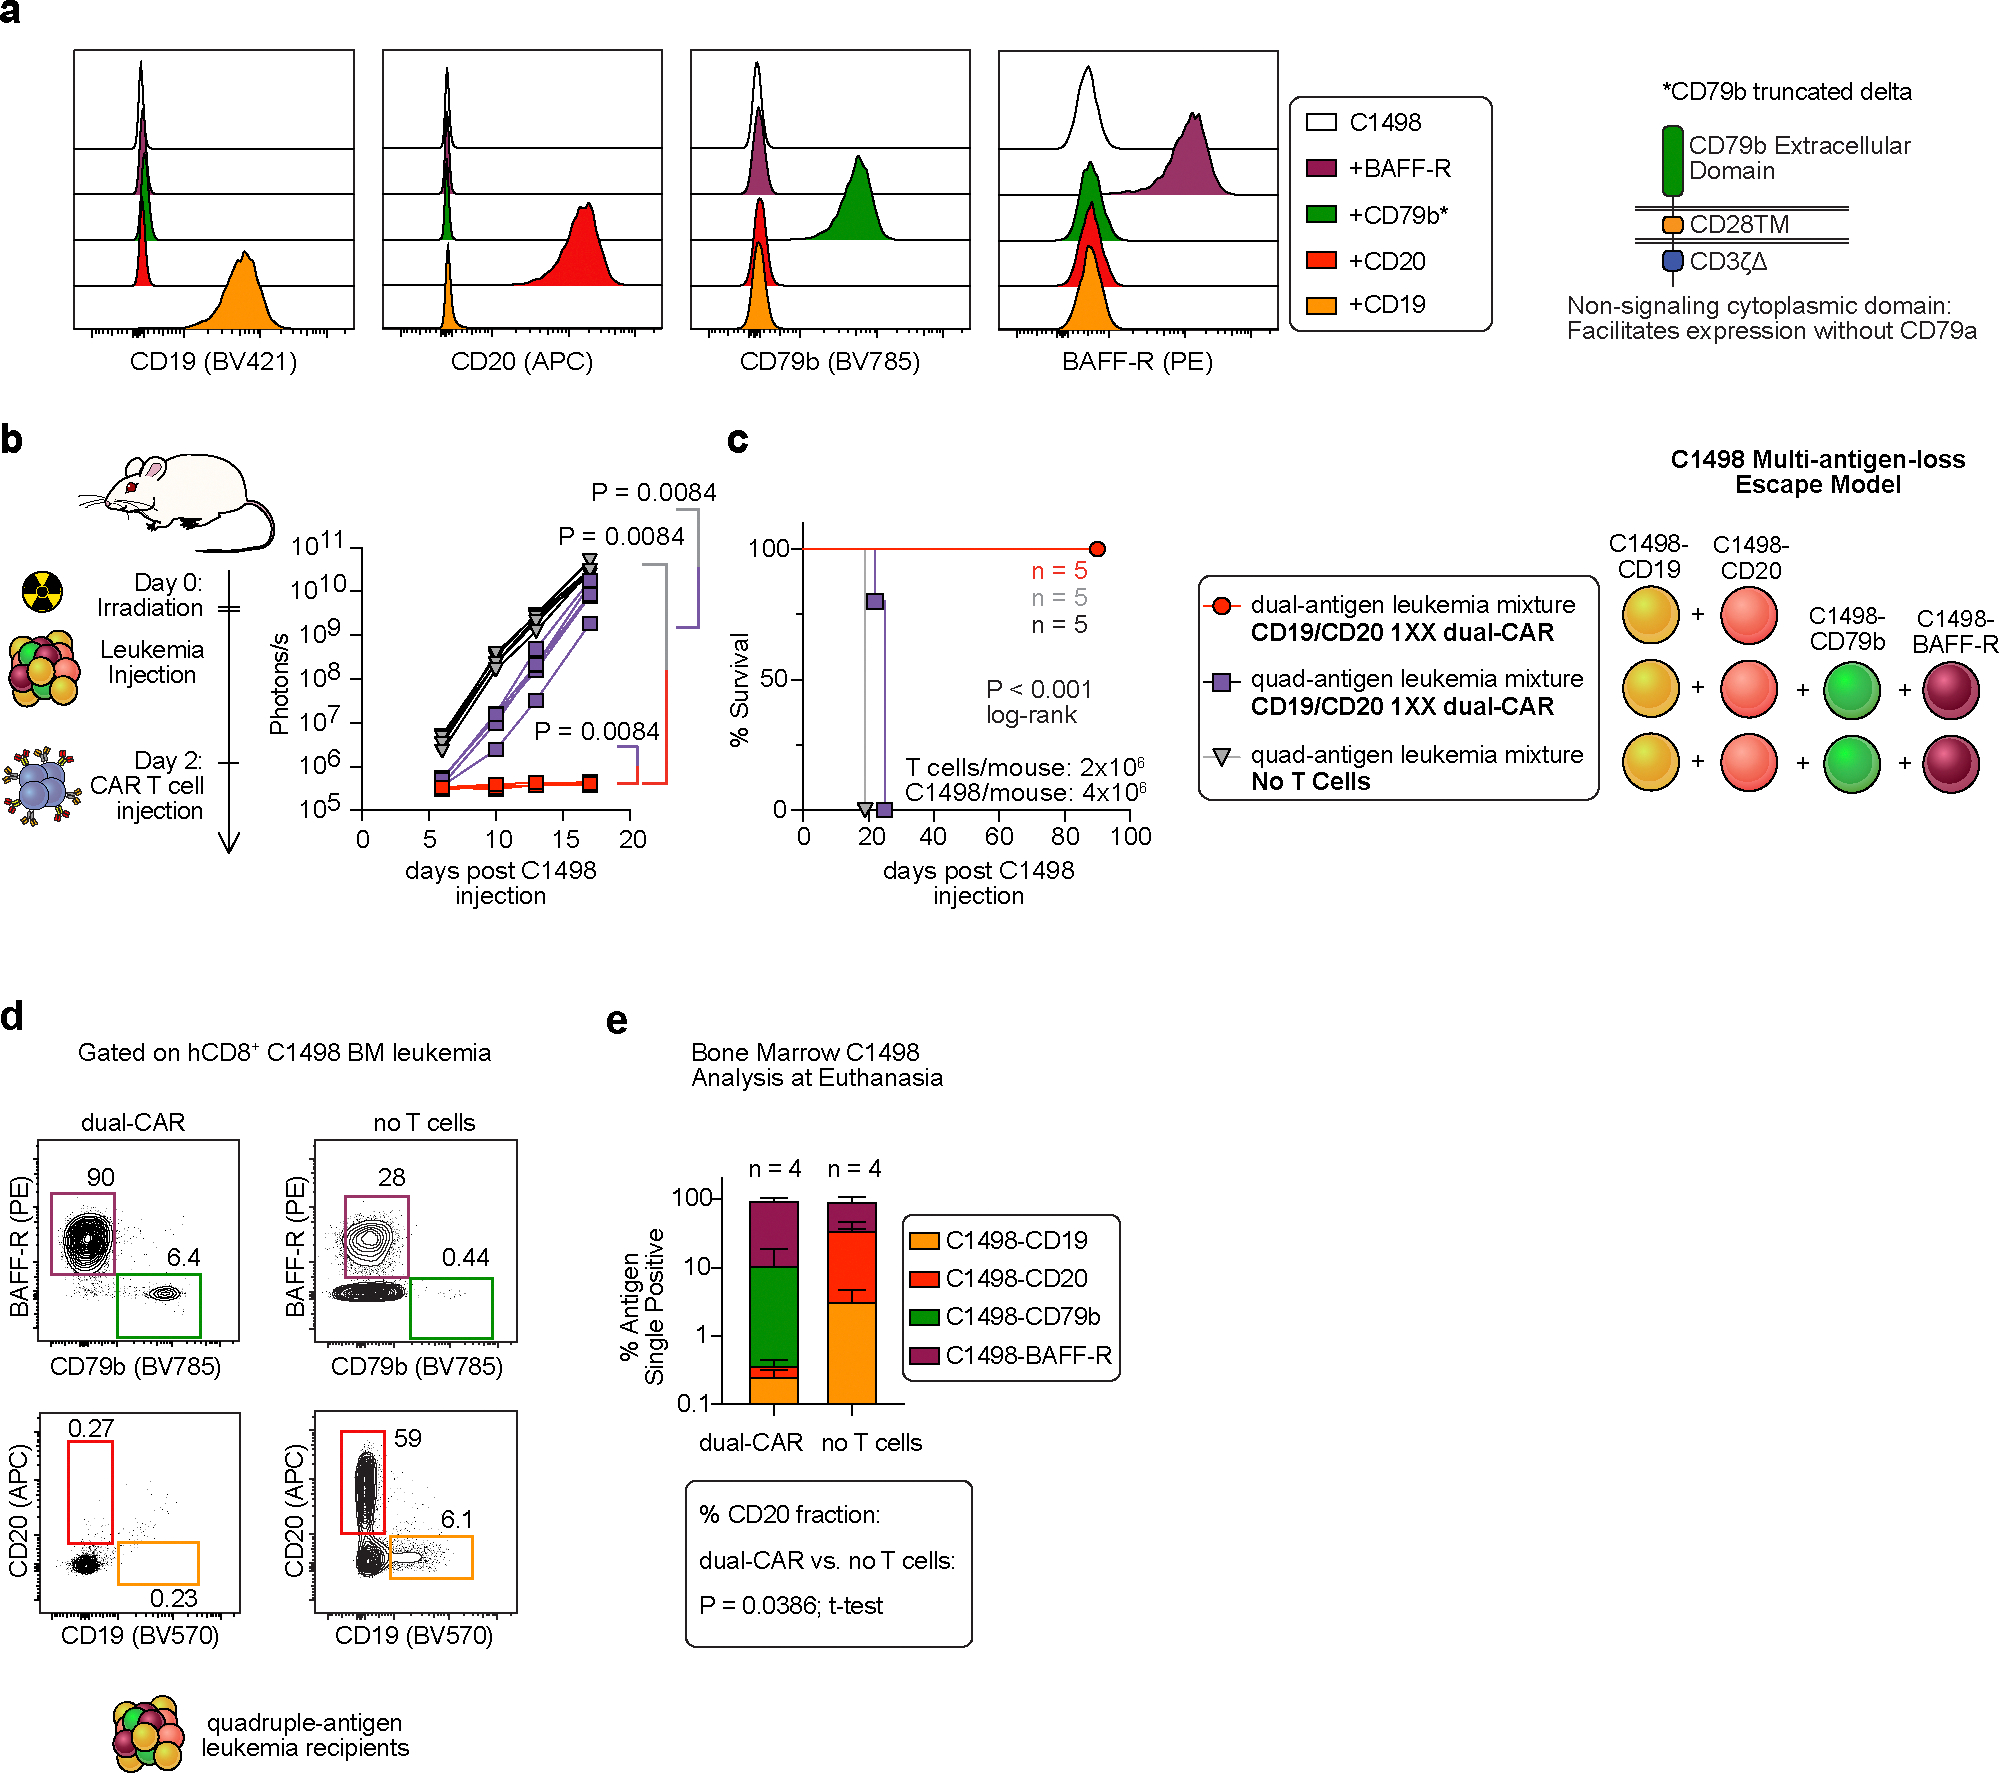
Resistance to chimaeric antigen receptor (CAR) T cell therapy develops through multiple mechanisms, most notably antigen loss and tumour-induced immune suppression. It has been suggested that T cells expressing multiple CARs may overcome the resistance of tumours and that T cells expressing receptors that switch inhibitory immune-checkpoint signals into costimulatory signals may enhance the activity of the T cells in the tumour microenvironment. However, engineering multiple features into a single T cell product is difficult because of the transgene-packaging constraints of current gene-delivery vectors. Here we describe a cell-sorting method that leverages leucine zippers for the selective single-step immunomagnetic purification of cells co-transduced with two vectors. Such 'Zip sorting' facilitated the generation of T cells simultaneously expressing up to four CARs and coexpressing up to three 'switch' receptors. In syngeneic mouse models, T cells with multiple CARs and multiple switch receptors eliminated antigenically heterogeneous populations of leukaemia cells coexpressing multiple inhibitory ligands. By combining diverse therapeutic strategies, Zip-sorted multi-CAR multi-switch-receptor T cells can overcome multiple mechanisms of CAR T cell resistance.


Conflict of interest statement

Competing interests: S.E.J., L.J., and M.R.M.v.d.B. are co-inventors on patent applications related to this manuscript (‘Leucine zipper-based compositions and methods of use’, nos. US20210171601A1 (USA), EP3836944A4 (Europe), WO2020037178A1 (WIPO), CA3109630A1 (Canada) and CN112930186A (China); ‘Cell sorting systems and methods of use’, nos. US20210179686A1 (USA), EP3837287A4 (Europe), WO2020037181A2 (WIPO), CA3109635A1 (Canada) and CN112996819A (China)). A.P.B. has consulted for Bristol Myers Squibb and Cancer Study Group, LLC, and has received honoraria from OncLive. F.D.B. is a founder of Biocept and has intellectual property licensed to Novartis. J.U.P. reports research funding, intellectual property fees and travel reimbursement from Seres Therapeutics as well as consulting fees from Da Volterra, CSL Behring and MaaT Pharma. He serves on an Advisory board of, and holds equity in, Postbiotics Plus Research. He has filed intellectual property applications related to the microbiome. S.A.V. has received funding from Bristol-Meyers Squibb and has received consulting fees from Koch Disruptive Technologies and Generate Biomedicine. C.A.K. has previously filed intellectual property applications related to the FasDNR featured in this manuscript. C.A.K. is a scientific co-founder and holds equity in Affini-T Therapeutics. C.A.K. has previously consulted for or is on the scientific and/or clinical advisory boards of: Achilles Therapeutics, Affini-T Therapeutics, Aleta BioTherapeutics, Bellicum Pharmaceuticals, Bristol Myers Squibb, Catamaran Bio, Cell Design Labs, Decheng Capital, G1 Therapeutics, Klus Pharma, Obsidian Therapeutics, PACT Pharma, Roche/Genentech, Royalty Pharma and T-knife. M.R.M.v.d.B. has received research support and stock options from Seres Therapeutics and stock options from Notch Therapeutics and Pluto Therapeutics; has received royalties from Wolters Kluwer; has consulted, received honoraria from or participated in advisory boards for Seres Therapeutics, Vor Biopharma, Rheos Medicines, Frazier Healthcare Partners, Nektar Therapeutics, Notch Therapeutics, Ceramedix, Lygenesis, Pluto Therapeutics, GlaxoSmithKline, Da Volterra, Thymofox, Garuda, Novartis (spouse), Synthekine (spouse), Beigene (spouse), Kite (spouse); has intellectual property licensing with Seres Therapeutics and Juno Therapeutics; and holds a fiduciary role on the Foundation Board of DKMS (a non-profit organization). MSKCC has institutional financial interests relative to Seres Therapeutics.

Figures

ED Fig. 1
ED Fig. 1. Covalently linked blocking-zipper inhibits extracellular leucine zipper pairing
a, Zip-sorting system vector maps. b, Vector map and diagram for EE-Thy1.1-P2A-BFP vector. c, Flow cytometry analysis of C1498 cells co-transduced with FLAG-RR-CBR-GFP and EE-Thy1.1-P2A-BFP vectors. Arrows depict combined intracellular + extracellular pairing (orange) and extracellular pairing (blue). d, Comparison of FLAG-zipper staining on dual-transduced (EGFP+ BFP+) and capture-zipper single-transduced (EGFP- BFP+) C1498 cells from four independent biological replicate co-transductions with FLAG-RR-CBR-GFP and EE-Thy1.1-P2A-BFP vectors as in panel c. Data are mean ± SEM of replicate samples. e, Maps of non-blocked EE-Thy1.1-P2A-BFP and blocked RR-EE-Thy1.1-P2A-BFP capture-zipper vectors. f, Diagrams and flow cytometry analysis of co-culture of single-transduced FLAG-zipper-secreting FLAG-RR-CBR-GFP C1498 with C1498 cells single-transduced with either (top) non-blocked EE-Thy1.1-P2A-BFP or (bottom) blocked RR-EE-Thy1.1-P2A-BFP capture-zipper vectors at depicted cell ratios for 48h. FLAG staining represents extracellular pairing of FLAG-RR zippers on single-transduced capture-zipper+ C1498 cells, which capture FLAG-RR zippers secreted into the media by single-transduced FLAG-RR-secreting C1498 cells. g, FLAG-RR zipper surface expression on C1498 cells expressing blocked or non-blocked capture-zippers depicted in panel f. n=1 transduction for each cell line and n=3 co-culture experiments. Data are mean ± SEM of triplicate samples. Error bars were too small to depict. h, Flow cytometry contour plots and histograms of unsorted, mixed populations of C1498 cells co-transduced with FLAG-RR-CBR-GFP and RR-EE-Thy1.1-P2A-BFP vector variants with capture zippers containing different repulsive mutations in blocking-zippers (See Supplementary Table 1). “EE” blocking-zipper is engineered to be fully repulsive against EE capture-zipper and maximally attractive towards the FLAG-RR zipper. Remaining mutants contain varying numbers of repulsive mutations “2 or 3” in the N-terminal “N” or middle “M” regions of the blocking-zipper. Representative of n=3 separate transductions. i, Diagram depicting predicted effect of repulsive amino acid substitution on zipper binding affinity. j, Maps for non-blocked and blocked EGFRt-based capture-zipper vectors. k, Flow cytometry analysis of C1498 cells dual-transduced with FLAG-RR-CBR-GFP and either (top) non-blocked EE-EGFRt-P2A-BFP or (bottom) blocked capture-zipper RR-EE-EGFRt-BFP. l, Zip-sort of FLAG-RR-CBR-GFP/RR-EE-EGFRt-P2A-BFP C1498 cells. Representative of n=2 transductions and Zip-sorts.
ED Fig. 2
ED Fig. 2. Zip-sorted dual-CAR T cells demonstrate CAR-dose-dependent upregulation of ROS and inhibitory receptor expression
a, Flow cytometry analysis of BM185-ffluc-Thy1.1-Neo cell lines expressing combinations of CD19 and CD20. b, Schematic depicting BM185 syngeneic mouse model of antigen-loss escape in CAR T cell immunotherapy for acute lymphoblastic leukemia. c-e. Sublethally irradiated BALB/c mice were injected with 1:1 mixture of BM185-CD19/BM185-CD20 at 1×10⁵ BM185/mouse (50x increased dose vs. Fig. 3g) and treated with Zip-sorted BALB/c CAR T cells on day 2. c, Leukemia BLI (ffluc) from two combined experiments. Log-transformed BLI values were compared using a Vardi test to compare AUC values with FDR correction for multiple comparisons. d, Day 10 BLI images from representative experiment. e, Survival, compared via log-rank test. f, PD-1 expression on resting Zip-sorted BALB/c CAR T cells. g, Linear regression analysis of unstimulated T cell PD-1 expression vs. number of signaling-competent CARs expressed, n=3 donors. h, Immunophenotype analysis of unstimulated Zip-sorted BALB/c CAR T cells; mean ± SEM from n=3 donors. i, Total cellular ROS (CM-H2DCFDA) analysis of resting Zip-sorted CAR T cells. j, Z-score normalized mean CM-H2DCFDA MFI ± SEM results of n=3 biological replicates. k, Mitochondrial superoxide (Mitosox Red) analysis of Zip-sorted CAR T cells. l, Z-score normalized mean Mitosox Red MFI ± SEM results of n=3 biological replicates. Statistical differences for ROS and mitochondrial superoxide were compared using one-way ANOVA, with Tukey’s test.
ED Fig. 3
ED Fig. 3. CAR T cell culture with NAC or dasatinib and ITAM attenuation enhances the anti-leukemia activity of dual-CAR T cells
a-b. BM185-CD19/BM185-CD20 antigen-loss escape model. BALB/c mice were treated with Zip-sorted dual-CAR BALB/c T cells cultured with 1 μM dasatinib (2 days), 10 mM NAC (3 days), or DMSO (3 days). a, Leukemia BLI from two combined experiments. Log-transformed BLI AUC values were compared using a Vardi test with FDR correction. b, Survival. c, NFAT, AP-1, or NFκB EGFP reporter analysis of unstimulated BALB/c T cells gated on dual-CAR positive or CAR-negative population following 24h culture with 1 μM dasatinib, 10 mM NAC, or DMSO. Representative of n=2 donor experiments, with mean ± SEM of triplicate wells. Statistical comparison via two-way ANOVA, with Tukey’s test. d-e, PD-1 and TOX expression in Zip-sorted dual-CAR or delta/delta BALB/c T cells following 24h co-culture with BM185-CD19 or no targets. Mean ± SEM of triplicate samples were compared with a two-way ANOVA, with Tukey’s test. f, Intracellular flow cytometry analysis of TCF1 and TOX expression in Zip-sorted dual-CAR or delta/delta BALB/c T cells cultured for 2 days with 1 μM dasatinib or DMSO. Representative experiments from n=2 donors. g, Diagram depicting ITAM mutations in 1XX CAR. h, Survival of BALB/c mice injected with BM185-CD19/BM185-CD20 (1:1) and treated with Zip-sorted dual-CAR WT CD3ζ or 1XX ITAM mutant dual-CAR T cells, from three combined experiments. i, Survival of BALB/c mice injected with dual-target-antigen expressing BM185-CD19-CD20 leukemia and treated with WT CD3ζ or 1XX dual-CAR T cells, from three combined experiments. Survival curves were compared via log-rank tests or pairwise log-rank test, with FDR correction.
ED Fig. 4
ED Fig. 4. Co-expression of BCL-2 with dominant negative receptors or combination with a single switch receptor transiently enhances anti-leukemia activity of dual-CAR T cells
a, (Left) Diagram and maps for vectors encoding combinations of the Zip-sorting system, CD19 and CD20 dual-CAR, BCL-2 D34A caspase-cleavage resistant mutant, iC9, 3N-mutant blocked zipper-tagged PD-1-DNR (DNR; dominant negative receptor), and FasDNR. 3N mutant blocking-zipper was used to increase affinity-tagged zipper surface expression (See Extended Data Fig. 1h). Tandem hCD20 mimotopes were added as expression tag and as a target for cell Rituximab-mediated depletion. (Right) Flow cytometry analysis of Zip-sorted BALB/c T cells dual-transduced with vectors as depicted in legend. Numbers in flow plots refer to post Zip-sort purity percentage for each marker. b, Maps for vector set encoding Q2-RR-iC9 and 3N zipper-tagged PD-1-CAR. c, Expression of PD-1-CAR and surface bound Q2-RR zipper. d, PD-L1 expression on BM185-CD20-PD-L1 clone. e, Luciferase-based 24h target lysis assay using Zip-sorted Q2-RR-iC9/3N-EE-PD-1-CAR BALB/c T cells or non-transduced T cells. Data are mean ± SEM of triplicate wells for a representative experiment from n=2 donor experiments. f-i. Sublethally irradiated BALB/c mice were injected with a 1:1 mixture of BM185-CD19 and BM185-CD20 and treated with Zip-sorted CD45.1+ congenic BALB/c T cells. f, Leukemia BLI (ffluc) from single experiment. g, Flow cytometry analysis of CAR T cells in peripheral blood on day 9. h, Linear regression analysis of leukemia BLI signal vs. blood CD45.1+ T cell concentration. i, Survival. j-l. Experimental setup as in panel f, but mice were treated with dual-CAR T cells incorporating FasBB switch receptor instead of FasDNR. j, Leukemia BLI from three combined experiments. k, Flow cytometry analysis of CAR T cells in peripheral blood on day 10, combined from two experiments. l, Survival from three combined experiments. Log-transformed BLI AUC values were compared using a Vardi test with FDR correction. Blood T cell counts were compared with a two-tailed t-test. Survival was compared with log-rank or pair-wise log-rank comparison with FDR correction.
ED Fig. 5
ED Fig. 5. Multi-Switch receptor arrays enhance T cell activity in response to inhibitory ligands
a-b, Flow cytometry analysis of Zip-sorted dual-CAR BALB/c T cells ± FasBB switch receptor co-cultured for 24h with BM185-CD19 (E:T = 1:1) or left unstimulated. Data are mean ± SEM (biological replicates) of triplicate wells from n=3 donor experiments. c, Vector maps for dual-CAR and switch receptor configurations as depicted in the table. d-g, Flow cytometry analysis of Zip-sorted dual-CAR, dual-CAR FasBB, and dual-CAR multi-Switch BALB/c T cells stimulated for 24h with BM185-CD19 (E:T = 1:2) or left unstimulated. Data are mean ± SEM (biological replicates) of triplicate wells from n=4 donor experiments. Statistical comparisons were calculated using two-way ANOVA, with Tukey’s test. h, Flow cytometry analysis of BM185-ffluc-Thy1.1-Neo cell lines engineered to express FasL, PD-L1, or CD200. i-k. Sublethally irradiated BALB/c mice were injected with 1:1:1 mixture of BM185-CD19-FasL, BM185-CD20-PD-L1, and BM185-CD20-CD200 and treated with Zip-sorted dual-CAR BALB/c T cells, pre-cultured for 2 days with 1 μM dasatinib. i, Leukemia BLI, and j, mouse survival, respectively, from one experiment. Survival differences were compared via log-rank test. k, Flow cytometry analysis of inhibitory ligand expression of single-ligand-positive BM185 lines harvested from bone marrow of mice reaching humane endpoints. PD-L1 expression difference was compared via a two-tailed t-test. Data are mean ± SEM (biological replicates). l, Live-cell microscopy (Incucyte) analysis of EGFP-labelled dual-CAR and dual-CAR triple-Switch Zip-sorted BALB/c T cells co-cultured with iRFP713+ BM185 target cell lines as depicted (E:T = 1:1), with repetitive target addition on days 0, 1, and 2. Representative of n=3 donor experiments. Data are mean ± SEM of triplicate samples. m, Live-cell microscopy (Incucyte) analysis of NFκB-EGFP-reporter labelled dual-CAR and dual-CAR triple-Switch Zip-sorted BALB/c T cells co-cultured with iRFP713+ BM185 target cell lines as depicted at E:T = 1:9. Representative of n=2 donor experiments. Values represent mean ± SEM of triplicate samples.
ED Fig. 6
ED Fig. 6. Co-expression of switch receptors attenuates inhibitory receptor upregulation, ROS production, and endoplasmic reticulum stress response activation
a, MAGIC imputed gene expression violin plots of inhibitory receptor and transcription factor genes for dual-CAR ± multi-Switch T cells related to Fig. 5. Differentially expressed genes were compared via Wilcoxon test prior to imputation. b, Flow cytometry analysis of dual-CAR ± multi-Switch T cells 24h following stimulation with BM185-CD19. Representative of n=2 donor experiments. c, Dual-CAR ± multi-Switch T cells were stained with CM-H2DCFDA to measure total ROS two days following the last TCR stimulation. Left, representative flow cytometry plots from one of two donors. Right, bar graphs depicting mean CM-H2DCFDA values from triplicate wells from n=2 donors. Replicate values were compared via one-way ANOVA, with Tukey’s test. Data are mean ± SEM. d, ER stress score gene set (GOBP_RESPONSE_TO_ENDOPLASMIC_RETICULUM_STRESS) comparison for dual-CAR ± multi-Switch T cells related to Fig. 5. Single-cell ER stress score values were compared via one-way ANOVA, with Tukey’s test. e, STRING analysis combining functional and physical protein interaction networks corresponding to the union of GO:0034976 ER stress response genes significantly upregulated (adjusted p value < 0.05) in CD4+ or CD8+ dual-CAR T cells compared with dual-Switch and triple-Switch T cells. Gene nodes without connecting edges were excluded. Thickness of edges indicates strength of data support. f, Heat map depicting gene scaled expression of selected ER stress response genes in the IRE1α and ATF6 ER stress pathways. g, Full GSEA pathway illustrations for Fig. 5g.
ED Fig. 7
ED Fig. 7. Dual-CAR T cells eliminate cognate targets and promote antigen-negative escape of leukemia mixture with high antigen heterogeneity
a, C1498 acute myeloid leukemia cell line was modified to singly express murine CD19, CD20, CD79bΔ (CD79b extracellular domain fused to CD28TM and CD3ζΔ; to promote surface expression without requiring CD79a co-expression), and BAFF-R. C1498 also was modified to express CBR, hCD8, and puroR. b-e. Albino B6 mice were sublethally irradiated and injected with either 1:1 mixture of C1498-CD19 and C1498-CD20 or a 1:1:1:1 mixture of C1498-CD19, C1498-CD20, C1498-CD79b, and C1498-BAFF-R and treated with dasatinib-cultured Zip-sorted dual-CAR 1XX T cells or left untreated. b, Leukemia BLI from single experiment. Log-transformed BLI AUC values were compared using a Vardi test with FDR correction. c, Survival. Differences in survival were compared with a log-rank test. d, Target antigen expression of representative C1498 leukemia harvested from bone marrow at time of euthanasia for leukemia progression. Gated on hCD8+ C1498. e, Target antigen expression on bone marrow leukemia obtained from mice reaching humane endpoints. % CD20+ C1498 fraction of total bone marrow C1498 was compared with two-tailed t-test. Data are mean ± SEM of biological replicates.
ED Fig. 8
ED Fig. 8. Multi-Switch receptor arrays enhance the activity of triple-CAR T cells
a, Diagrams and vector maps for triple-CAR ± dual-Switch receptor arrays. b, Flow cytometry analysis of Zip-sorted triple-CAR and triple-CAR dual-Switch albino B6 T cells. Numbers in flow plots represent post-sort purity percentage for each construct. c, 24h luciferase-based target lysis assay with Zip-sorted BAFF-R/CD79b/CD20 triple-CAR BALB/c T cells with targets as depicted. Data are mean ± SEM of triplicate wells. d-f. Sublethally irradiated albino B6 mice were injected with 1:1:1 ratio of C1498-CD20, C1498-CD79b, C1498-BAFF-R and treated with dasatinib-cultured triple-CAR ± dual-Switch T cells co-transduced with a membrane-bound Gaussia luciferase (gLuc) vector: gLuc-PD-1H-CD24-GPI-P2A-EGFP for T cell BLI. d, C1498 BLI (CBR). e, Survival; from a single experiment. f, T cell BLI (Gaussia). Data are mean ± SEM of biological replicates. g-h. Experimental setup as in panels d-f, but with stress-test 0.4×10⁶ T cell dose and T cell BLI not performed. g, C1498 BLI from two combined experiments (left) and images from representative experiment (right). h, Survival. Log-transformed BLI AUC values were compared using a Vardi test with FDR correction. Survival differences were compared via pairwise log-rank test, with FDR correction.
ED Fig. 9
ED Fig. 9. Quad-CAR T cells including a single-domain antibody-based CD19-CAR demonstrate cognate target lysis, but exhibit limited anti-leukemia activity in vivo
a, Diagram and vector maps for quad-CAR receptor array. b, Flow cytometry analysis of CAR expression. c, 24h luciferase-based target lysis assay with quad-CAR B6 T cells and targets as listed. Data are mean ± SEM of triplicate wells for representative experiments from n=2 donors. d-g, Sublethally irradiated albino B6 mice were injected with 1:1:1:1 ratio of C1498 singly expressing (hCD19, CD20, CD79bΔ, BAFF-R) and treated with dasatinib-cultured quad-CAR albino B6 T cells co-transduced with Gaussia luciferase vector gLuc-PD-1H-CD24-GPI-P2A-EGFP. d, C1498 BLI from three combined experiments with different BLI imaging timing. BLI AUC values were compared using a Vardi test with FDR correction. e, Survival. Differences in survival were compared with a log-rank test. f, Representative day 20 T cell BLI (Gaussia) and day 21 C1498 BLI (CBR) images. g, Antigen expression analysis from C1498 harvested from bone marrow of mice reaching humane endpoints. % hCD19+ C1498 was compared with two-tailed t-test. Data are mean ± SEM of biological replicates.
ED Fig. 10
ED Fig. 10. Immunophenotype profiling of quad-CAR and quad-CAR triple-Switch T cells
a-n, Resting and BM185-CD20-stimulated quad-CAR and quad-CAR triple-Switch T cells (as depicted in Fig. 6), were analyzed by multiparameter spectral flow cytometry. Cells were stimulated at 1:1 E:T ratio with BM185-CD20 for 24h or left unstimulated without IL-2. a, t-Distributed Stochastic Neighbor Embedding (t-SNE) projection with flowSOM metaclusters depicting combined stimulated and unstimulated CD4+ quad-CAR and quad-CAR triple-Switch T cells (n=3 concatenated technical replicates from triplicate wells). b, tSNE projections illustrating flowSOM metaclusters separated by stimulated and un-stimulated quad-CAR and quad-CAR triple-Switch T cell populations. c, tSNE projections depicting endogenous PD-1 and PD-1-OX40 switch receptor expression. d, Population distributions of stimulated (top) and un-stimulated (bottom) T cell products in metaclusters. e, tSNE projections of selected protein expression for combined stimulated and un-stimulated quad-CAR and quad-CAR triple-Switch T cells. f, Heat map depicting Z-score transformed median fluorescence intensity expression values depicted for proteins in stimulated and un-stimulated quad-CAR and quad-CAR triple-Switch T cells. g, Histograms depicting protein expression for selected markers. h-n, Concurrent analysis of CD8+ T cell populations as in panels a-g. Data are representative of n=2 donor experiments with triplicate wells. In d and k, mean of technical replicates and individual data replicates are depicted.
Fig. 1:
Fig. 1:. Engineering a leucine zipper-based cell sorting system
a, Leucine zipper sorting system principle. b, Predicted pre- and post-Zip-sorting results. c, Flow cytometry analysis of C1498 cells dual-transduced with FLAG-RR-CBR-GFP and EE-MHC-I-TM-P2A-BFP vectors. d, Zip-sorted purified cells from panel c. e, Yield and purity results from three Zip-sorts of cells described in panel c. Sort yield is defined as 100*(dual-transduced cells recovered/dual-transduced cells present pre-sort). Data are mean ± SEM (standard error of mean) of n=3 Zip-sorts. f, Diagram depicting intracellular (1) and extracellular (2) zipper pairing pathways. g, Proposed model of blocking-zipper promoting intracellular zipper pairing pathway by blocking extracellular pairing pathway. h, Flow cytometry analysis and Zip-sort results of C1498 cells co-transduced with FLAG-RR-CBR-GFP and EE-Thy1.1-P2A-BFP vectors. i, Flow cytometry analysis and Zip-sort results of C1498 cells co-transduced with FLAG-RR-CBR-GFP and RR-EE-Thy1.1-P2A-BFP vectors (performed at the same time as panel h). Transduced cell lines were generated at least twice (independent transductions) with 1–2 Zip-sorts tested per replicate cell line. j, Flow cytometry analysis comparing surface FLAG-zipper staining on unsorted cell products from biological replicate C1498 co-transductions as in panels h-i. Each data point represents an independent C1498 transduction. Data are mean ± SEM for individual biological replicates.
Fig. 2:
Fig. 2:. Vector integration analysis and immunogenicity prediction of Zip-sorted primary T cells
a, Flow cytometry analysis of primary mouse T cells co-transduced or single-transduced with serial dilutions of retrovirus encoding Zip-sorting system components and EGFP and BFP reporters as depicted. Cells were immunomagnetically sorted with FLAG-beads (co-transduced) or Thy1.1 beads (single-transduced). b, Pre- and post-sorting BFP and EGFP expression. c, Pre- and post-sorting BFP MFI. d, Average vector copy number in immunomagnetically sorted primary T cells co-transduced or single-transduced with serial dilutions of retrovirus (same biological replicates as depicted in panels a-c). e, Relative vector copy number in co-transduced vs. single-transduced immunomagnetically sorted primary T cells. For a-e, data are mean ± SEM from three separate transductions from n=3 donors. f-g, Next generation sequencing-based genomic vector integration study results from immunomagnetically sorted co-transduced and single-transduced primary T cells from 1:9 retrovirus dilution biological replicate transductions depicted in panel a. f, Relative, per chromosome, vector integration in co-transduced vs. single-transduced immunomagnetically sorted primary T cells. Data points are biological replicate samples, with one-way ANOVA comparing relative integrations among chromosomes. g, Estimated number of T cells sharing unique vector integration sites per sample for co-transduced and single-transduced T cells. Data from biological replicates for co-transduced or single-transduced sample were concatenated and compared via Wilcoxon rank-sum test. h, IEDB prediction of peptide immunogenicity scores from the RR-EE blocked zipper or full-length sequences of tisagenlecleucel (tisa-cel) and axicabtagene ciloleucel (axi-cel) presented on HLA-A (*01:01, *02:01, *03:01, *24:02), HLA-B (*07:02, *08:01, *35:01, *44:02), and HLA-C (*04:01, *06:02, *07:01, *07:02) MHC class I molecules. (Left) immunogenicity score of sequential peptides derived from depicted construct sequences with specified HLA molecules (N to C terminus). (Middle) average immunogenicity scores and score distributions for all positively scoring peptides derived from each construct. (Right) average immunogenicity scores and score distributions for positively scoring non-human peptides derived from each construct.
Fig. 3:
Fig. 3:. CD19/CD20 dual-CAR T cells prevent antigen loss escape in a heterogeneous leukaemia model
a, Diagrams and vector maps for dual-CAR T cell design. b, CAR expression on BALB/c primary T cells dual-transduced with FLAG-RR-iC9-CD1928z / RR-EE-Thy1.1-CD2028z vector set. c, Percent cell recovery (yield) and purity of Zip-sorted cells. n=7 biological replicates; mean ± SEM. d, Relative survival of Zip-sorted T cells treated with AP20187. Representative of n=2 donor experiments with triplicate wells; mean ± SEM. e, Relative survival of T cells incubated with complement and anti-Thy1.1 antibody for 30 minutes. Performed twice on T cells from one donor mouse with triplicate wells; mean ± SEM. f, 24h luciferase-based target lysis assay of Zip-sorted B6 dual-CAR T cells vs. C1498 targets. Representative experiment from n=2 donor experiments with triplicate wells; mean ± SEM. g-j, BM185-CD19/BM185-CD20 antigen-loss escape model. g, Leukaemia BLI (ffluc) from four combined superimposed experiments. Log-transformed BLI values were compared using a Vardi test with false discovery rate (FDR) correction to compare area under the curve (AUC, see Methods). h, Survival, compared via log-rank test. i, Representative analysis of splenic BM185 populations at time of euthanasia for leukaemia progression. j, Target antigen expression on splenic BM185 leukaemia. % CD19+ fraction compared using one-way ANOVA with Tukey’s test for pairwise comparisons. CD19 and CD20-CARs in panels b-f, used CD8 hinges, while in panels g-j, the CD19-CAR used CD8 hinge and CD20-CAR used CD28 hinge to reduce potential heterodimerization. Data are mean ± SEM of biological replicates.
Fig. 4:
Fig. 4:. Co-expression of multiple switch receptors enhances the anti-leukaemia activity of dual-CAR T cells
a, Diagram depicting CAR signalling-induced inhibitory molecule expression. b, Switch receptor design and principle. c, Diagram for dual-CAR ± multi-Switch receptor T cells. hCD20-tag stalk (R2-PD-1H-CD28TM-CD3ζΔ) replaces iC9 in multi-Switch configurations as a rituximab binding safety-switch for optional T cell depletion. d, Expression of CARs, safety-switches, and switch receptors in Zip-sorted BALB/c T cells. Numbers in flow plots represent post-sort purity for each construct. e-g. NFκB-reporter live-cell imaging (Incucyte) analysis of Zip-sorted BALB/c T cells stimulated with BM185-CD19-iRFP713 (E:T = 1:2) or unstimulated. e, (Top) Serial measurement of NFκB-EGFP reporter fluorescence intensity. (Bottom) EGFP+ T cell counts relative to initial values. (Right) iRFP713+ BM185-CD19 counts relative to initial values. f, Kinetic enumeration of large EGFP+ T cell clusters measuring at least 5000 μm2. Values represent mean ± SEM of triplicate samples, representative of n=3 donor experiments. AUC values were calculated in Prism and compared via one-way ANOVA, with Tukey’s test. g, Representative EGFP+ T cell cluster mask images of CAR T cells stimulated with BM185-CD19. h-i, BM185-CD19/BM185-CD20 antigen-loss escape model. Mice were treated with stress-test dose Zip-sorted dual-CAR BALB/c T cells. h, Leukaemia BLI from two combined experiments. i, Survival. j-k. Sublethally irradiated BALB/c mice were injected with 8:1:1 mixture of BM185-CD19-FasL, BM185-CD20-PD-L1, and BM185-CD20-CD200 and treated with stress-test dose Zip-sorted dual-CAR BALB/c T cells, pre-cultured for 2 days in 1 μM dasatinib. j, Leukaemia BLI from two combined experiments with different BLI imaging timing. k, Survival. BLI AUC were compared using a Vardi test with FDR correction. Survival differences were compared via pairwise log-rank test, with FDR correction.
Fig. 5:
Fig. 5:. Multi-Switch receptor CAR T cells demonstrate reduced transcriptomic signatures of exhaustion and maintain enhanced effector function
a, Zip-sorted BALB/c T cells transduced with dual-CAR, dual-CAR dual-Switch, and dual-CAR triple-Switch vector sets were stimulated with BM185-CD19 for 24h. CD4+ and CD8+ T cells were sorted, combined at 1:1 ratio, and submitted for scRNAseq. Sequencing was performed with two biological replicates per CAR vector set and concatenated by construct set for analysis. b, UMAP projection of CD4 and CD8 clustering for concatenated data set including all CAR T cell lines. c, Heat maps depicting gene scaled expression of genes encoding endogenous inhibitory receptors and their corresponding switch receptors. d, Heat map depicting gene scaled expression of selected genes significantly differentially expressed (adjusted p value < 0.05) between dual-CAR and dual-CAR dual-Switch T cells or dual-CAR and dual-CAR triple-Switch T cells. e, GSEA analysis of dual-CAR ± triple-Switch T cells for interferon gene sets. Dual-CAR ± dual-Switch T cells did not significantly differentially enrich these subsets. f, GSEA analysis of dual-CAR exhaustion gene signatures in dual-CAR ± multi-Switch T cells as depicted. g, GSEA pathway analysis of dual-CAR ± multi-Switch T cells as depicted (see Extended Data Fig. 6g for individual pathway names). h, Heat map of multi-cytokine analysis of dual-CAR ± triple-Switch T cells left unstimulated or stimulated for 24h with BM185-CD19. i, Heat map of multi-cytokine analysis of dual-CAR ± triple-Switch T cells challenged every 24h (three times total) with BM185-CD19-FasL, BM185-CD20-PD-L1, or BM185-CD20-CD200. Data are depicted as biological replicate Z-score transformed mean values of triplicate wells from n=2 donors. Log-transformed non-scaled cytokine data were compared using a two-way ANOVA, with Sidak’s test. j, Residual BM185 luminescence following repeated stimulation in panel i. Representative of n=2 donor experiments is shown as mean ± SEM of triplicate wells.
Fig. 6:
Fig. 6:. Multi-Switch receptor arrays enhance the activity of quad-CAR T cells
a, Diagram and vector maps used in quad-CAR, quad-CAR dual-Switch, and quad-CAR triple-Switch receptor arrays. b, Cell diagrams and flow cytometry analysis of CAR and switch receptor expression in Zip-sorted B6 T cells. Numbers in flow plots represent post-sort purity percentage for each construct. c-h. Sublethally irradiated albino B6 mice were injected with 1:1:1:1 ratio of C1498 singly expressing hCD19, CD20, CD79b, or BAFF-R and treated with dasatinib-cultured quad-CAR albino B6 T cells co-transduced with Gaussia luciferase vector gLuc-PD-1H-CD24-GPI-P2A-EGFP and expressing switch receptors as depicted. c, Experimental setup diagram. d, Representative day 13 T cell BLI and representative example of femur BLI region of interest. e, Total T cell BLI kinetics (left) and femur BLI kinetics (right) from two combined experiments. Data are mean ± SEM. f, C1498 BLI from two combined experiments. g, Representative day 21 leukaemia BLI images. h, Survival. Log-transformed BLI AUC values were compared using a Vardi test with FDR correction. Survival differences were compared via pairwise log-rank test, with FDR correction. i, Live-cell imaging (Incucyte) analysis of quad-CAR and quad-CAR triple-Switch T cells stimulated at low E:T ratios with C1498 target cells expressing target antigens as depicted. T cells (EGFP) and tumour cells (iRFP713) were imaged simultaneously. The E:T ratios at which quad-CAR T cells failed to control C1498 are depicted: 1:3 for C1498-hCD19 and C1498-CD20 and 1:9 for C1498-CD79b and C1498-BAFF-R. Curves are mean ± SEM of triplicate samples.
Fig. 7:
Fig. 7:. Summary of Zip-sorting system and multi-CAR multi-Switch T cells
a, Zip-sorting system directs single-step immunomagnetic purification of dual-vector-transduced cells. The blocking-zipper strategy enables zipper modification of safety-switches, DNRs, switch receptors, and CARs by promoting preferential surface expression of the affinity-tagged zipper on dual-transduced cells. b, (Top) Proposed mechanism for enhanced proliferation of multi-Switch CAR T cells in response to leukaemia targets without inhibitory ligand overexpression. Antigen stimulation drives upregulation of PD-L1 and CD200 on dual-CAR FasBB switch receptor-expressing T cells. PD-1-OX40 and CD200R-CD27 switch receptors signal in response to T cell-expressed inhibitory ligands. (Bottom) Proposed mechanism for enhanced proliferation and survival of multi-Switch CAR T cells in response to leukaemia targets with inhibitory ligand overexpression. Direct stimulation of switch receptors via tumour cell-expressed inhibitory ligands promotes TNFRSF signalling and T cell costimulation. FasBB inhibits Fas/FasL-mediated T cell death (dominant negative function). c, Dual-CAR T cells promote immunoediting and antigen-negative outgrowth of leukaemia in response to a leukaemia population heterogeneously expressing four tumour-associated antigens. Triple-CAR and quad-CAR T cells target greater number of antigens and can overcome higher antigen heterogeneity. Co-expression of multiple switch receptors promotes proliferation and enhances anti-leukaemia activity of multi-CAR T cells.

References

    1. June CH & Sadelain M Chimeric Antigen Receptor Therapy. N. Engl. J. Med. 379, 64–73 (2018). - PMC - PubMed
    1. Mikkilineni L & Kochenderfer JN CAR T cell therapies for patients with multiple myeloma. Nat. Rev. Clin. Oncol. 18, 71–84 (2021). - PubMed
    1. Berger TR & Maus MV Mechanisms of response and resistance to CAR T cell therapies. Curr. Opin. Immunol. 69, 56–64 (2021). - PubMed
    1. Majzner RG & Mackall CL Tumor Antigen Escape from CAR T-cell Therapy. Cancer Discov. 8, 1219–1226 (2018). - PubMed
    1. Labanieh L & Mackall CL CAR immune cells: design principles, resistance and the next generation. Nature 614, 635–648 (2023). - PubMed

Substances

LinkOut - more resources