. 2025 Mar;25(1):1-17.
doi: 10.1007/s40268-024-00495-1. Epub 2024 Dec 24.

Evaluation of BCRP-Related DDIs Between Methotrexate and Cyclosporin A Using Physiologically Based Pharmacokinetic Modelling

Affiliations

Evaluation of BCRP-Related DDIs Between Methotrexate and Cyclosporin A Using Physiologically Based Pharmacokinetic Modelling

Stephan Schaller et al. Drugs R D. 2025 Mar.

Abstract

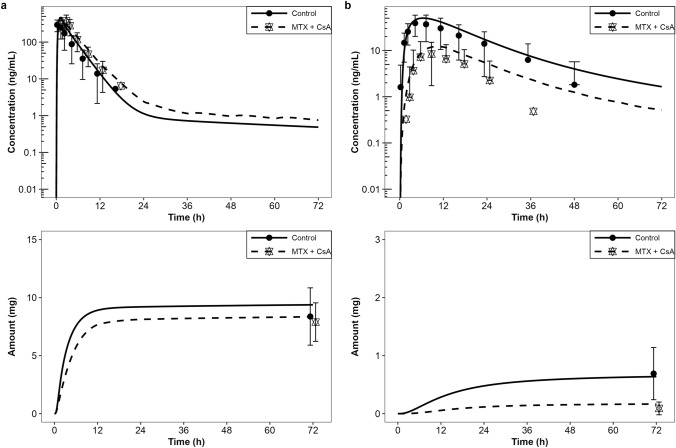
Background and objective: This study provides a physiologically based pharmacokinetic (PBPK) model-based analysis of the potential drug-drug interaction (DDI) between cyclosporin A (CsA), a breast cancer resistance protein transporter (BCRP) inhibitor, and methotrexate (MTX), a putative BCRP substrate.

Methods: PBPK models for CsA and MTX were built using open-source tools and published data for both model building and for model verification and validation. The MTX and CsA PBPK models were evaluated for their application in simulating BCRP-related DDIs. A qualification of an introduced empirical uniform in vitro scaling factor of Ki values for transporter inhibition by CsA was conducted by using a previously developed model of rosuvastatin (sensitive index BCRP substrate), and assessing if corresponding DDI ratios were well captured.

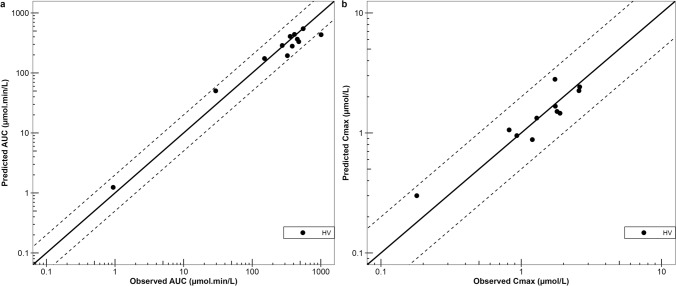
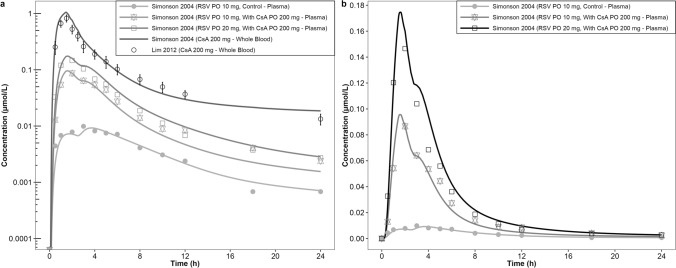
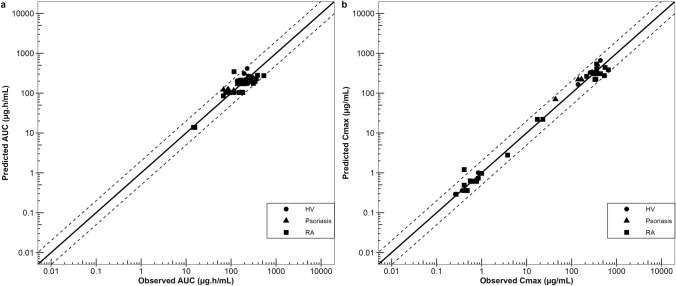
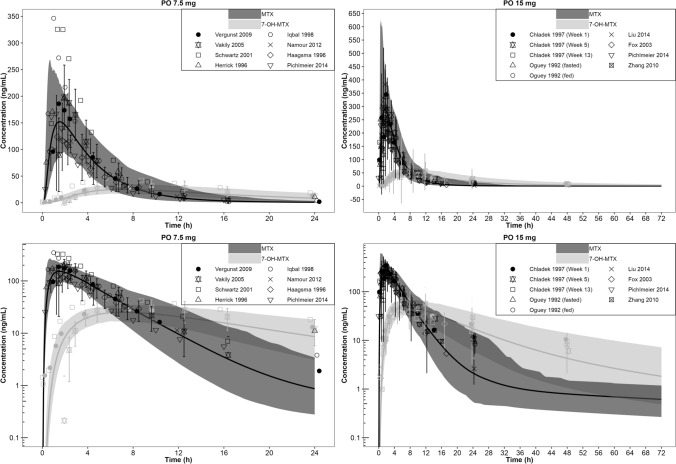
Results: Within the simulated DDI scenarios for MTX in the presence of CsA, the developed models could capture the observed changes in PK parameters as changes in the area under the curve ratios (area under the curve during DDI/area under the curve control) of 1.30 versus 1.31 observed and the DDI peak plasma concentration ratios (peak plasma concentration during DDI/peak plasma concentration control) of 1.07 versus 1.28 observed. The originally reported in vitro Ki values of CsA were scaled with the uniform qualified scaling factor for their use in the in vivo DDI simulations to correct for the low intracellular unbound fraction of the CsA effector concentration. The resulting predicted versus observed ratios of peak plasma concentration and area under the curve DDI ratios with MTX were 0.82 and 0.99, respectively, indicating adequate model accuracy and choice of a scaling factor to capture the observed DDI.

Conclusions: All models have been comprehensively documented and made publicly available as tools to support the drug development and clinical research community and further community-driven model development.


Conflict of interest statement

Declarations. Funding: This study was sponsored by Galapagos NV. Conflicts of Interest/Competing Interests: Stephan Schaller and Vanessa Baier are employees of esqLABS. Frederico Martins was an employee of esqLABS at the time of the work and is now an employee of Simulations Plus, Inc. Ingrid Michon was an employee of SGS Exprimo at the time of the work and is now an employee of Certara. Patrick Nolain was an employee of Galapagos at the time of the work and is now an employee of Novo Nordisk. Amit Taneja was an employee of Galapagos at the time of the work and owns subscription rights in the company, and is now an employee of Simulations Plus, Inc. esqLABS and SGS Exprimo are contract research organisations that were sponsored by Galapagos to conduct the study presented here. Ethics Approval: No ethical approval was required, as all data used in the article have been taken from publicly available sources. Consent to Participate: Not applicable. Consent for Publication: Not applicable. Availability of Data and Material: All available data used are included in the article (either referenced or in the tables). Code Availability: Not applicable. Authors’ Contributions: All authors contributed to the study’s conception and design. Material preparation, data collection and analysis were performed by SS, IM, VB, FM, PN and AT. The first draft of the manuscript was written by SS, and all authors commented on previous versions of the manuscript. All authors read and approved the final manuscript.

Figures

Fig. 1
Fig. 1
A Workflow for the model development, validation and application to investigate methotrexate (MTX) as a victim of breast cancer resistance protein transporter (BCRP) inhibition. B Visualisation of the evaluated (minimal) drug–drug interaction (DDI) network. Blue arrow depicts metabolic process, green arrows depict transport processes. Red lines depict inhibition of processes by cyclosporin A (CsA). In addition to BCRP transport, CsA also inhibits organic anion transporting polypeptides (OATPs) 1B1 and 1B3 and P-glycoprotein (P-gp) transport of rosuvastatin (RSV) and digoxin. AOX aldehyde oxidase
Fig. 2
Fig. 2
Observed and predicted whole blood (and plasma, panel a and b) pharmacokinetic profiles of cyclosporin A (CsA) in peripheral venous blood following single intravenous (IV) and oral (PO) doses that range from 2 to 1400 mg (linear scale). Symbols represent the observed, and lines represent the simulated time–concentration profiles of CsA. Formulations used are: Sandimmune Capsule (panels c–f) and Neoral (panels g and h). Panel i shows all IV data. Observed data are referenced in Table S2 of the ESM. h hours
Fig. 3
Fig. 3
Observed (symbols) and predicted (lines) whole blood pharmacokinetic profiles of cyclosporin A (CsA) [black] and metabolites M1 + M17 (grey) following a 1.5-mg/kg intravenous (IV) dose (panel a) and a 5-mg/kg oral (PO) dose (panel b) of CsA. Plots are on a log scale. Observed data are referenced in Table S2 of the ESM. h hours
Fig. 4
Fig. 4
Comparison between simulated and observed pharmacokinetic parameters of cyclosporin A from all studies. Solid lines represent the line of unity; dashed lines represent a two-fold difference. AUC area under the curve, Cmax peak plasma concentration, HV healthy volunteer
Fig. 5
Fig. 5
Qualification of cyclosporin A (CsA) as an inhibitor of breast cancer resistance protein transporter (BCRP)-related drug transport with BCRP substrate rosuvastatin (RSV), displaying concentration–time curves for RSV (and CsA) pharmacokinetics (PK) with and without co-administration of CsA. Patients received 10 g of RSV alone (control; no data are available for the 20-mg control cohort) or 10 mg or 20 mg of RSV with 200 mg of CsA [38]. The left panel is on a log scale and includes CsA PK that were not reported with the study, but observed data were taken from Lim et al. [70] (see also Fig. 2, panel h), which were omitted from the right panel for improved visualisation. h hours, PO orally
Fig. 6
Fig. 6
Outcomes for the methotrexate (MTX) PBPK model development using training data sets (Table S1 of the ESM) for doses of 15 mg intravenously (left panel) and orally (right panel). Grey dots and curves represent observed and simulated data for MTX, while black stars and curves represent observed and simulated data for MTX metabolite 7-OH-MTX. Top panels correspond to the plasma concentration–time curves, while bottom panels depict the amount of the respective compounds excreted in urine over time. Plots are on a log scale. h hours, PBPK physiologically based pharmacokinetic
Fig. 7
Fig. 7
Comparison between simulated and observed pharmacokinetic parameters area under the curve (AUC) [left panel] and peak plasma concentration (Cmax) [right panel] of methotrexate from all studies, separated by population types. Solid lines represent the line of unity; dashed lines represent a two-fold difference. HV healthy volunteer, RA rheumatoid arthritis
Fig. 8
Fig. 8
Methotrexate (MTX) PBPK model qualification using validation data sets (Table S1 of the ESM) for oral (PO) doses of 7.5 and 15 mg. Black dots and curves represent observed and simulated data for MTX, while grey dots and curves represent observed and simulated data for MTX metabolite 7-OH-MTX. The shaded areas correspond to the 5th–95th percentile range of simulated time–concentration profiles of a population simulation (n = 100, 50% female, aged 18–65 years). Plots are on a log scale. h hours, PBPK physiologically based pharmacokinetic
Fig. 9
Fig. 9
Single oral dose of methotrexate (MTX) 15 mg combined with oral doses of cyclosporin A (CsA) 1.5 mg/kg twice daily. Left panels represent plasma concentrations (top) and the amount excreted in urine (bottom) for MTX and right panels represent the same for MTX-OH. Solid lines and dots represent the control arm, whereas dashed lines and stars represent the arm with concomitant treatment with CsA. h hours

Similar articles

Cited by

References

    1. Waters NJ. Evaluation of drug-drug interactions for oncology therapies: in vitro-in vivo extrapolation model-based risk assessment. Br J Clin Pharmacol. 2015;79:946–58. 10.1111/bcp.12563. - PMC - PubMed
    1. Ishiguro A, Sato R, Nagai N. Development of a new Japanese guideline on drug interaction for drug development and appropriate provision of information. Drug Metab Pharmacokinet. 2020;35:12–7. 10.1016/j.dmpk.2019.11.009. - PubMed
    1. FDA Center for Drug Evaluation and Research. In vitro drug interaction studies: cytochrome P450 enzyme- and transporter-mediated drug interactions guidance for industry. 2020. Available from: https://public4.pagefreezer.com/browse/FDA/15-09-2021T19:20/https:/www.f.... Accessed 18 Oct 2022.
    1. EMA. Investigation of drug interactions. 2018. Available from: https://www.ema.europa.eu/en/investigation-drug-interactions. Accessed 18 Oct 2022.
    1. Endres CJ, Hsiao P, Chung FS, Unadkat JD. The role of transporters in drug interactions. Eur J Pharm Sci. 2006;27:501–17. 10.1016/j.ejps.2005.11.002. - PubMed

MeSH terms

LinkOut - more resources