. 2024 Dec 23;2(1):127.
doi: 10.1038/s44271-024-00177-3.

A neurocognitive mechanism for increased cooperation during group formation

Affiliations

A neurocognitive mechanism for increased cooperation during group formation

Wojciech Zajkowski et al. Commun Psychol. .

Abstract

How do group size changes influence cooperation within groups? To examine this question, we performed a dynamic, network-based prisoner's dilemma experiment with fMRI. Across 83 human participants, we observed increased cooperation as group size increased. However, our computational modeling analysis of behavior and fMRI revealed that groups size itself did not increase cooperation. Rather, interaction between (1) participants' stable prosocial tendencies, and (2) dynamic reciprocal strategy weighed by memory confidence, underlies the group size-modulated increase in cooperation because the balance between them shifts towards the prosocial tendency with higher memory demands in larger groups. We found that memory confidence was encoded in fusiform gyrus and precuneus, whereas its integration with prosocial tendencies was reflected in the left DLPFC and dACC. Therefore, interaction between recall uncertainty during reciprocal interaction (i.e., forgetting) and one's individual prosocial preference is a core pillar of emergent cooperation in more naturalistic and dynamic group formation.


Conflict of interest statement

Competing interests: The authors declare no competing interests.

Figures

Fig. 1
Fig. 1. Task design.
A Steps of a single trial in the embedded-dyad network Prisoner’s Dilemma (NEDPD) task, with (right insert) a recreation of the PD choice task screen shown that contains current group members’ avatars, the subject’s avatar, and the cumulative score. The experimental avatars consisted of photos from the NimStim database. Here we use images from the open access OpenMoji (openmoji.org) database as their symbolic representation. B A cartoon schematic of task components described in (A), where “S” is the subject and “P” are partners. C Rolling average of cooperation rate (green) and group size (red) as a function of trial for two sample participants. D Group level rolling average of cooperation rate (upper panel) and group size (lower panel) as a function of trial. Background lines represent 3 sample subjects with high, medium and low cooperation rates.
Fig. 2
Fig. 2. Behavioral results.
Cooperation (left) and reciprocity (right) as a function of group size (A) and interaction distance (B). Red dotted line indicates chance level (50%). C Response times for cooperation (green) and defection as a function of group size (C) and ID (D). Error bars and ribbons represent 95% CI.
Fig. 3
Fig. 3. Cognitive modeling.
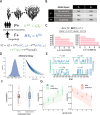
A Hypothesis space, aimed at explaining why people cooperate more in larger groups. Increasing prosociality hypothesis (P+) assumes a linear increase in cooperation as a function of group size. Forgetting hypothesis (F+) assumes an exponential decay in memory retention (MR) of partner’s previous choice as a function of interaction distance, which then influences the value of reciprocation. Bottom row represents the full value function, color-coded in line with the hypotheses. B Tested model space. C Model fit scores based on LOOIC (left) and WAIC scores (right). For clearer visualization, the scores were relativized with respect to the winning and plotted on a natural logarithmic scale. Vertical red line represents 8-point difference, which signifies a significantly better fit. D Posterior distribution of the memory decay parameter k (left) and the predicted memory decay as a function of ID (right). E Winning model choice predictions (blue lines) vs observed choices)green dots) for 4 participants on a subset of trials. Pearson correlation coefficients r in the subplot titles relate to overall choice-prediction correlations for given participant. F Individual correlations between predicted and actual cooperative choices for 2 subsamples of participants. G Simulated model predictions (ribbon, width representing 95% CI) for cooperation and reciprocity, plotted against empirical values estimated from the data (error bars represent 95% CI).
Fig. 4
Fig. 4. Brain representations of model-based predictions.
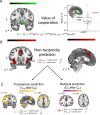
A Value of cooperation was predictive of activations within the ventral striatum/Nucleus Accumbens (whole-brain analysis) and theoretically-derived ROI associated with value within the vmPFC. B Model-derived value of non-reciprocity was associated with activity within the bilateral AI and dACC. C Prediction of forgiveness (left) was associated with wide-spread activity across dorsolateral and medial areas, as well as the cerebellum. Prediction of betrayal was associated with bilateral activity within the DLPFC. All whole-brain analyses were conducted using a p < 0.05 cluster-wise family-wise error rate (FWE)-corrected, cluster forming threshold p < 0.001.
Fig. 5
Fig. 5. Neural correlates of forgetting.
A Whole-brain analysis revealed precuneus and bilateral fusiform gyri to be associated with memory decay p < 0.05 cluster-wise FWE corrected, cluster forming threshold p < 0.001. B Connectivity between precuneus (seed) and two ROIs of interest: bilateral fusiform (left) and NAcc (right). Each point represents participant-specific connectivity strength decrease as a function of Ft, averaged across ROI voxels.
Fig. 6
Fig. 6. Congruence by distance interaction effects.
A Whole-brain analysis showing a significant cluster within the left DLPFC p < 0.05 cluster-wise FWE corrected, cluster forming threshold p < 0.001. B Results from 4 a priori defined ROIs. Error bar length represents 2 standard errors around the mean.

Similar articles

References

    1. Nash, J. F. Equilibrium points in n-person games. Proc. Natl Acad. Sci.36, 48–49 (1950). - PMC - PubMed
    1. Trivers, R. L. The evolution of reciprocal altruism. Q. Rev. Biol.46, 35–57 (1971).
    1. Axelrod, R. & Hamilton, W. D. The evolution of cooperation. Science211, 1390–1396 (1981). - PubMed
    1. Nowak, M. A. & Sigmund, K. Tit for tat in heterogeneous populations. Nature355, 250–253 (1992).
    1. Gracia-Lázaro, C., Cuesta, J. A., Sánchez, A. & Moreno, Y. Human behavior in Prisoner’s Dilemma experiments suppresses network reciprocity. Sci. Rep.2, 325 (2012). - PMC - PubMed

LinkOut - more resources